Title: “Are BRICS countries already challenging the US-led world order? | The Bottom Line” https://youtu.be/FwOXoLlq0l8?feature=shared
-
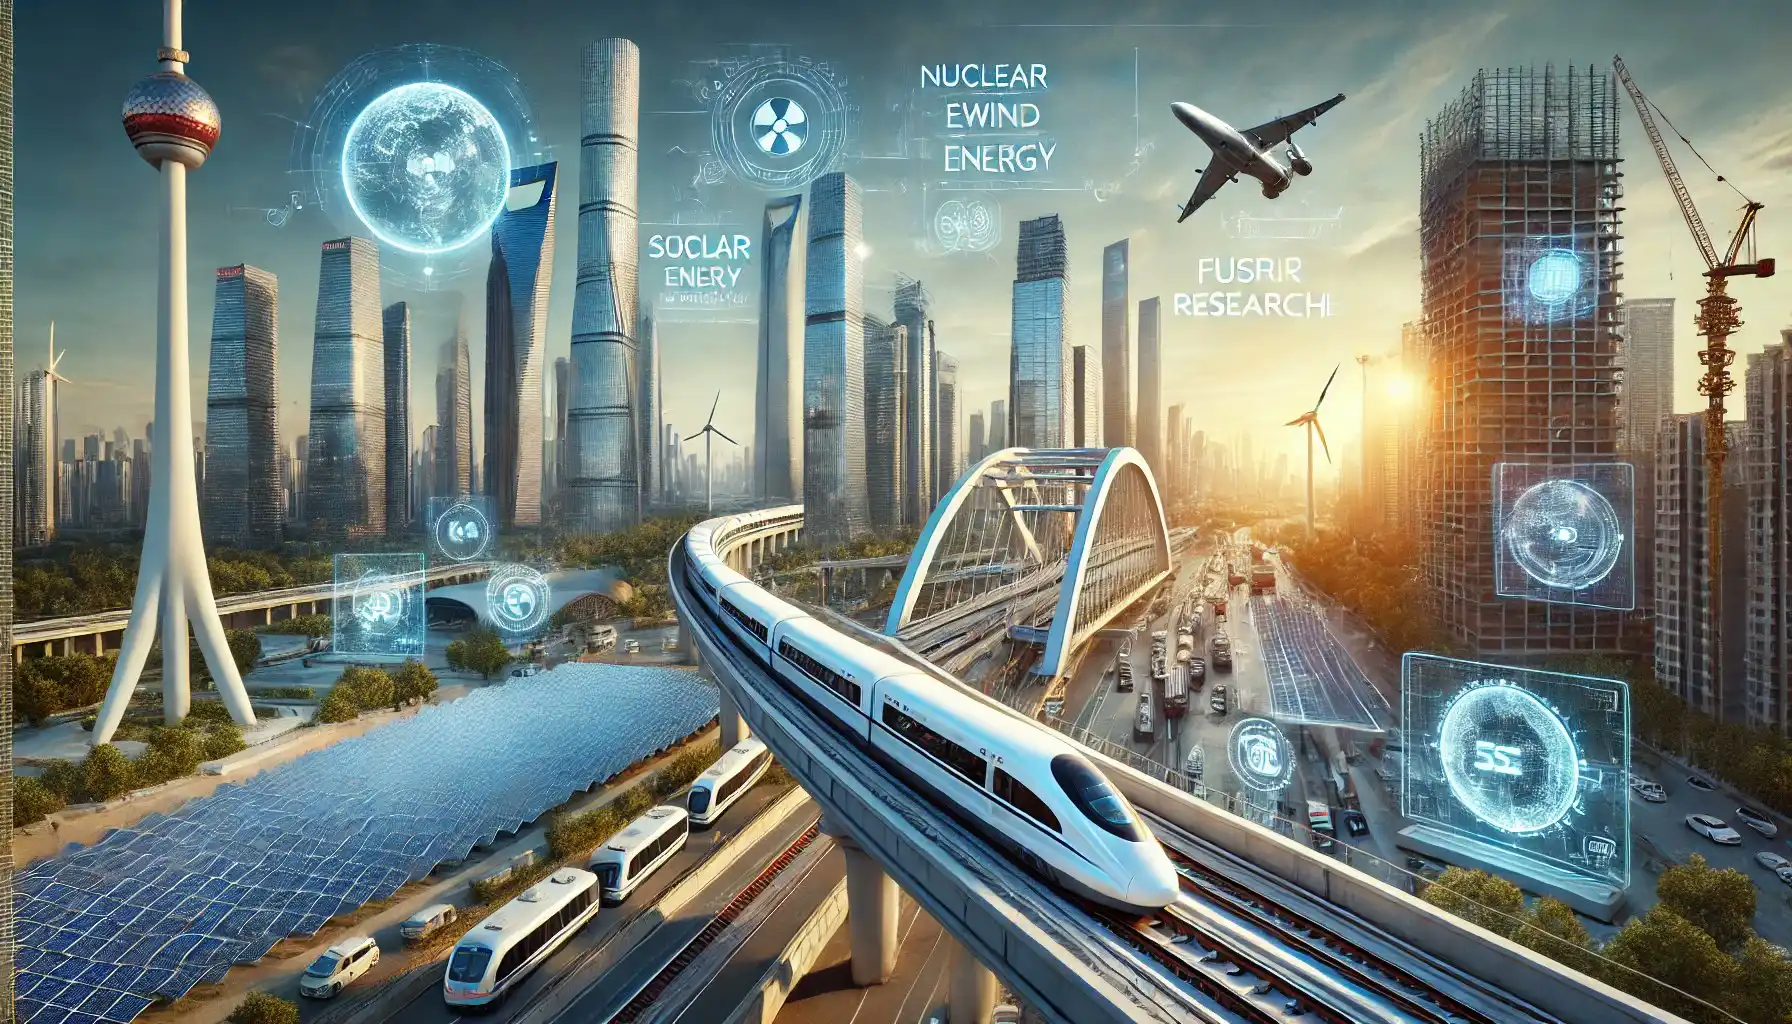
High-Speed Rail (HSR) China: 42,000 km (largest HSR network globally). USA: 0 km (no high-speed rail, though planning is in progress).
-
Solar Panel Production China: 75% of global solar panel production. USA: Less than 2% of global solar production.
-
Nuclear Power China: 55 operational reactors, 24 under construction (second-largest globally). USA: 93 operational reactors, 2 under construction (largest globally but slowing).
-
Natural Gas Production USA: 934 billion cubic meters/year (world’s largest producer). Russia: 701 billion cubic meters/year (second-largest).
-
Oil Production USA: 11.6 million barrels/day (world’s largest). Russia: 10.1 million barrels/day (second-largest).
-
Copper Mining Chile: 5.7 million metric tons/year (largest producer globally). USA: 1.2 million metric tons/year.
-
Gold Mining China: 370 metric tons/year (world’s largest producer). Russia: 330 metric tons/year (second-largest).
-
Uranium Mining Kazakhstan: 21,819 tons/year (world’s largest producer). Canada: 7,258 tons/year.
-
Rare Earth Mining China: 168,000 metric tons/year (dominates with about 60% of global production). USA: 43,000 metric tons/year.
-
Electronics Production China: Accounts for over 40% of global electronics manufacturing. USA: 10-15% of global production.
-
Computer Production China: Manufactures over 90% of the world’s laptops and PCs. USA: Minor share, largely designs (e.g., Apple) but outsources manufacturing.
-
Artificial Intelligence USA: Leading in AI software development (companies like OpenAI, Google, etc.). China: Major in AI hardware and surveillance technologies.
-
Robotics Production China: 70% of global industrial robots production. USA: Less than 10% of global production.
-
Ship Construction China: Largest shipbuilder, over 40% of global output. USA: Less than 5% of global output, mostly focused on military and specialized vessels.
-
Military Aircraft Production USA: Leading globally with companies like Lockheed Martin, Boeing producing F-35, F-22, etc. China: Rapidly growing with J-20, and other indigenous fighter jets.
-
Tank Production Russia: Significant, modernized T-90 and T-14 Armata tanks. China: Mass production of the Type 99 and Type 96 tanks.
-
Missile Production USA: Leads in advanced missile systems (Patriot, Tomahawk, Trident). Russia: Strong in missile technology (S-400, S-500, Kalibr, ICBMs).
-
Wheat Production China: 136 million tons/year (largest producer). USA: 49 million tons/year.
-
Soybean Production USA: 108 million tons/year (largest producer). Brazil: 139 million tons/year (surpassed the USA).
-
Commodities Storage China: Largest stockpiler of strategic commodities, including grain, oil, and metals.
-
Airplane Manufacturing USA: Boeing (over 400 aircraft/year before production issues). EU: Airbus (also over 400 aircraft/year). China: COMAC (recently launched the C919, aims to compete with Boeing and Airbus).
-
EV Production China: 5.7 million EVs/year (largest EV producer). USA: 1.1 million EVs/year (Tesla as leading producer).
-
Bus Production China: Dominates global electric bus production, accounting for over 90% of the world’s total.
-
Drug Manufacturing India: World’s largest supplier of generic drugs (20% of global supply). China: Major producer of raw pharmaceutical ingredients. USA: Leading in high-value R&D for pharmaceuticals.
-
Consumer Goods Manufacturing China: Largest global exporter of consumer goods. USA: Far smaller percentage, more focused on high-tech goods.
-
Product Exports China: $3.36 trillion (largest exporter globally). USA: $1.76 trillion.

Related Content:
Title: “The Soviet Union vs. Dr. Jordan B. Peterson: How Far the USSR Would Go to Annihilate an Ideological Threat” https://x.com/SkillsGapTrain/status/1847382579386995078
Title: “BRICS vs. Soviet Union: How a United Bloc Surpasses the Cold War Superpower” https://x.com/SkillsGapTrain/status/1847423165775171895
Title: “The Dragon’s New Clothes: How the CCP Mirrors Neoliberalism of Liberal Party (2015 to 2024)” https://x.com/SkillsGapTrain/status/1824274616149262565
Title: “Yes. Great Info. Here are more details that we found: At the outset of the war in 1939, Canada’s population was around 11 million.” https://x.com/SkillsGapTrain/status/1841318964653408400
Title: “Why a Naval Invasion of BC Is Easier from China than India: A Strategic Breakdown” https://x.com/SkillsGapTrain/status/1846508482700440029
Title: “Critique of the 15-Minute City Model: A Call for Practicality, Sustainability, and Security” https://x.com/SkillsGapTrain/status/1843922512050004143
Title: “The Great Convergence: Resisting the Digital Authoritarianism & Centralized Control of Smart Cities for a Future of Genuine Progress and Freedom” https://x.com/SkillsGapTrain/status/1843323244805538150
Title: “Taking the Life Out of Canada: Systematic Erosion of Security, Prosperity, and National Identity” https://x.com/SkillsGapTrain/status/1842000157874733303
Title:“Battle for Humanity: How Rising Ideological Extremism Could Ignite a Century of Conflict” https://x.com/SkillsGapTrain/status/1830676962895110416
Title: “You’re absolutely right — Canada is far from ready, and it’s time we acknowledge the truth about our military capabilities.” https://x.com/SkillsGapTrain/status/1840141909857116275
Title:“Canada’s Total Systems Crisis: Navigating a Multi-Sectoral ‘Everything Crisis’ https://x.com/SkillsGapTrain/status/1834967253424418876
Title:“The Strategic Importance of Canada in World War 3” https://x.com/SkillsGapTrain/status/1811674417812111626
Title: “Canada’s Future at Risk: The New Global Threats to Our Borders and Security” https://x.com/SkillsGapTrain/status/1824932362905333768
To see our Donate Page, click https://skillsgaptrainer.com/donate
To see our YouTube Channel, click https://www.youtube.com/@skillsgaptrainer