Hello and welcome to “User Experience – Applied Research and Design”. I put together this course because I know there are a lot of workers out there who’ve never done UX, but would like to learn the profession. At the same time, the demand for well trained UX researchers and designers continues to grow. Often times, a lot of aspiring UX professionals or even the companies that wish to employ such professionals, don’t truly understand what’s involved. UX is more than nice graphics! UX is about creating products that are easy to use and please the user. UX is about understanding user needs and how the product can meet their needs. It is about how the users interact with information and how they navigate the design. This course aims to reveal the extent of the UX process, and to provide a comprehensive resource which practitioners can use as a model when undertaking their own UX projects.
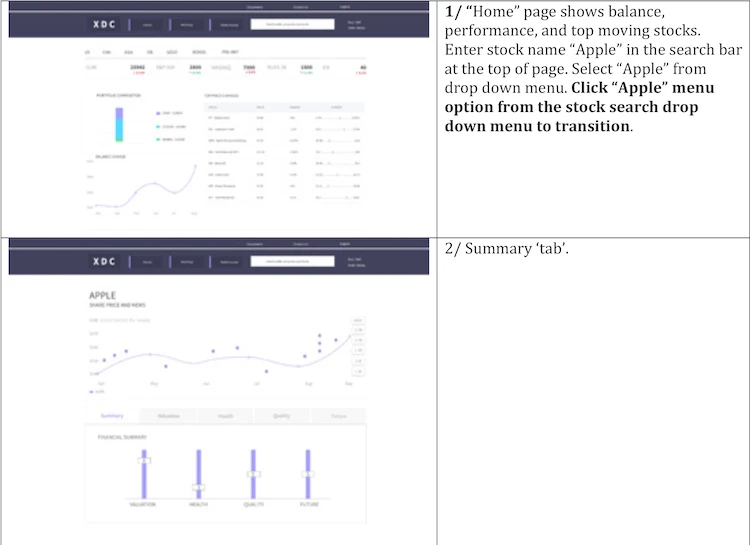
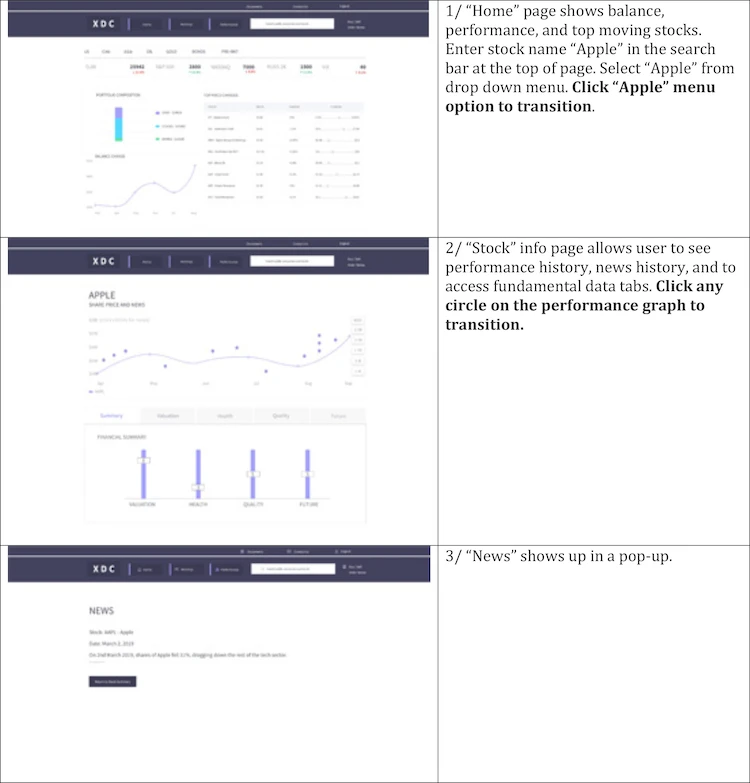
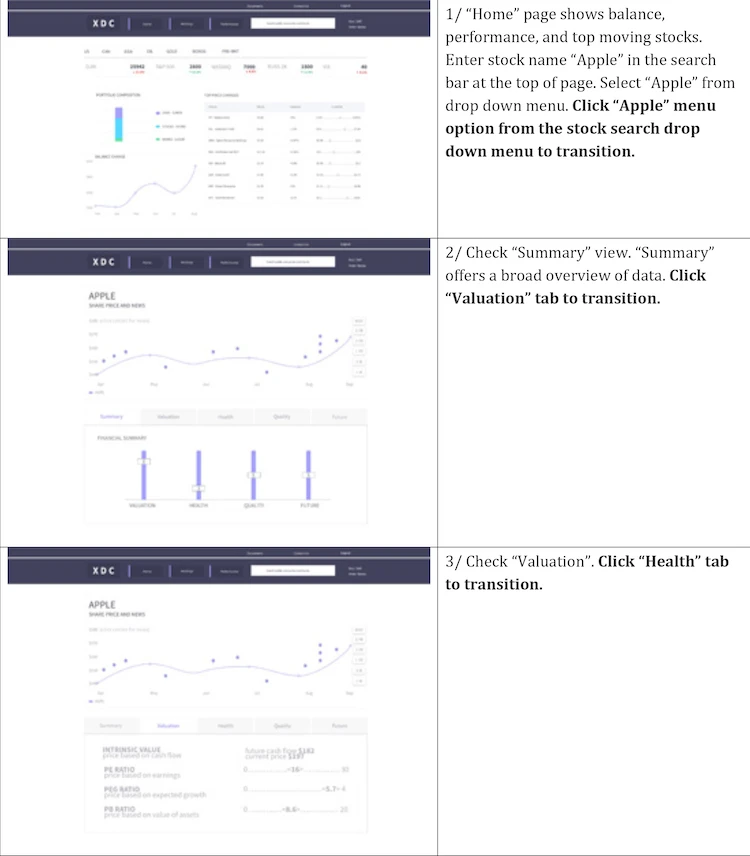
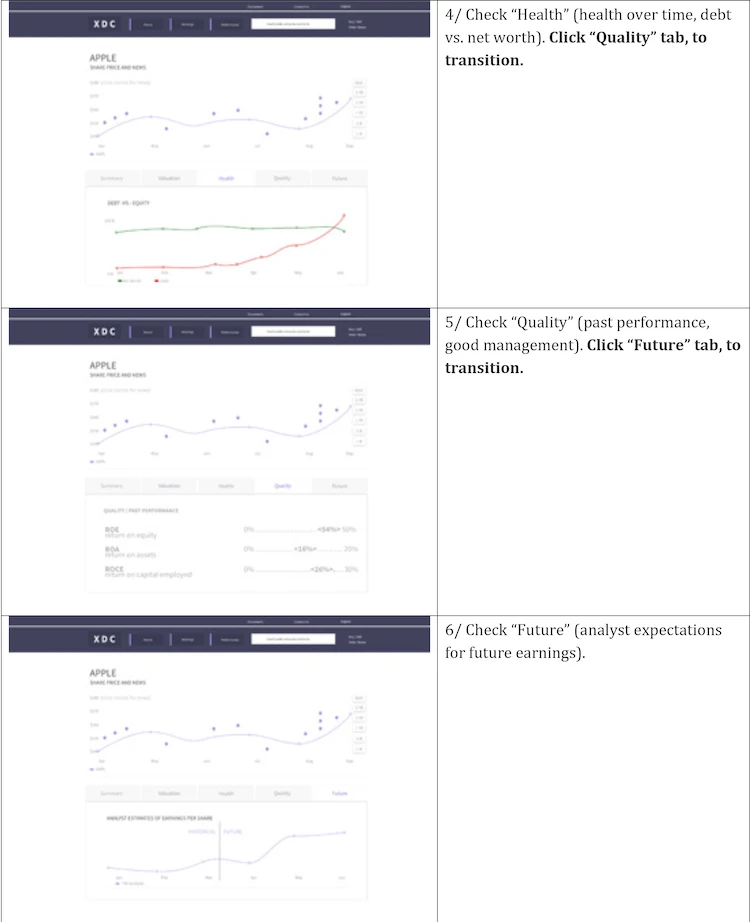
Becoming a UX professional is easier for some, then for others. Individuals with experience related to social science research or technology may have a big advantage. Anyone with a background in web development, software development, graphic design, research, psychology, engineering or business analysis: is especially well suited. My goal was to create a course that would offer a fast, but comprehensive overview of the UX research and design process.
The first part of the course starts out with an introduction to UX, but quickly ramps up to to present the intermediate and advanced process behind UX. You will gain an understanding of what is involved in UX research and UX design. You will learn how to conduct interviews, evaluate products, and analyze products using principles of design. You will also learn about the creation of prototypes of low fidelity, medium fidelity and at high fidelity. The second part of the course showcases a lengthy and significant UX design project where learners are able to see the type of analysis, research and process required in an applied UX project. The entire process from initial concept through to finished prototype will be demonstrated. You will gain access to professional resources in the form of research reports. The reports can be used as a guide or template for your own UX project development. By reviewing five different phases of a UX project, you will learn what reports/deliverables are expected as part of a major product design endeavour.
What you’ll learn
learn what the tasks and responsibilities of a UX designer are
learn about the UX research process
learn how to conduct professional research for a UX project
learn skills relating to the design of interactive systems
learn skills relating to user interaction
learn to explain the iterative nature of the design process
learn to explain how designers approach complex problems
learn research methods for understanding user needs (interviews, observation, affinity walls..)
use research data to architect information effectively
understand how UX researchers find and evaluate user needs
understand how UX researchers assess possible designs
understand how UX designers use sketching and prototyping to develop design concept
show to design systems that work for users by evaluating systems with users
how to design and conduct a “user needs” study
how to conduct “user testing” session
show to report your “user testing” results
how to design, conduct, assess “usability tests”how to create reports for “usability tests”
learn how to assess designs using visual design principles
learn why ideation and sketching is important
analyze personas, scenarios and storyboards
analyze wire-frames, prototypes, user interviews, affinity diagrams, usability tests, surveys and questionnaires used in a UX project
Who is this course for:
anyone interested in becoming a UX researcher/designer
anyone who wants to learn the UX process
anyone who needs to explain the UX process
job seekers who wish to pass interviews in UX
for designers who want to progress into a senior role
designers – graphic designers, UX/UI designers or web designers
developers – software developers or web developers
entrepreneurs
beneficial to individuals with graphic design skills
beneficial to individuals with web design skills
beneficial to individuals who wish to build interactive systems and products
INTRODUCTION TO: USER EXPERIENCE (UX) – Applied Research and Design
Hello and welcome to “USER EXPERIENCE (UX) – Applied Research and Design”
I put together this course because I know there are a lot of workers out there who’ve never done UX, but would like to learn the profession.
Becoming a UX professional is easier for some, then for others. UX is a field which developed out of the fields of usability and human factors, fields which are related to software development. Individuals with experience related to social science research or technology may have a big advantage. Anyone with a background in web development, software development, graphic design, research, psychology, engineering or business analysis: is especially well suited. My goal was to create a course that would offer a fast, but comprehensive overview of the UX research and design process. The course starts out with an introduction to UX, but quickly ramps up to to present the intermediate and advanced process behind UX. The second part of the course showcases a lengthy UX project where learners are able to see the type of analysis, research and process required in an applied UX project.
User Experience is not just about designing something that looks visually and aesthetically stunning, but it is a profession with many components that contribute towards delivering an excellent experience. User Experience is a professional field which contains several disciplines. The main components are user experience design and user research. User experience design refers to the interactions a user has with a product. User research refers to understanding users and their needs.
User experience is essential to all kinds of products and services. The creation of a digital product should be overseen by someone who is familiar with the principles of user experience. Applying user experience fundamentals to the design process leads to the design of products which are more usable, pleasant and engaging to the end customer. Products designed with user experience in mind end up doing better in the marketplace, offering the brands which they represent with a competitive advantage. A bad user experience will ensure that people do not come back for another visit. A user experience which is not bad, but only acceptable, will not guarantee that the user does not go to a competitor. Though advanced features may be a good selling point, most users end up being loyal to the brands which have the better user experience rather than the most advanced functionality.
It is the research process that is often overlooked as part of design work. It is the research process that often needs explaining to colleagues, supervisors, employers and clients. For these reasons, the emphasis of this course will be on the research process that is used to understand users and their needs.
User Experience is a discipline where professionals use research and design principles to create products that provide users with a great experience. The course will describe the essentials of user experience, specifically, it will describe user experience research that can be used during the product design process. The course will also discuss the design process and offer an overview of analysis principles relevant to UX. After describing the theoretical foundations, the course will delve into a comprehensive and practical breakdown of a UX project. Specifically, in the second part of the course, the UX process is presented with work deliverables from an “enhanced stock trading application with professional data capability”.
WHAT IS A GOOD EXPERIENCE?
We have all noticed at some point or another, that some brands, produce products which are consistently “better” than their competition. Most of the time, when we think of a product having a criteria which is superior, we are actually thinking about the experience which we’ve had with the product. Sometimes we purchase a product and the experience is great, and at other times, the experience is dreadful. So what is a good and what is a bad experience? A good experience occurs when we get a product that is perhaps pleasant to use, fun to use, easy to use, useful for our tasks and perhaps even looks like it has a good design. On the other hand, a bad experience is one that can be described as stressful, confusing, inefficient and perhaps with no visual aesthetic. Another interesting aspect that differentiates good experience from bad, deals with whether or not the product is flexible in that it allows the user to do the task as they wish. Is the product consistent within their understanding, or does it force the user to take a particular path which the designer sets. It can be a frustrating experience to deal with a unique product design that does not fit the norms of knowledge that a user may have. This could result in a bad experience. Lastly, a very important aspect to consider is whether or not the users experience success with the system while also allowing the company to achieve its objectives. After all, if the product or system does not solve the problem which the user has, why would the user come back for repeat business?
THE UX PROCESS EXPLAINED
We can break down the UX process into several phases, including: evaluation, design, implementation. In the evaluation phase, we attempt to understand the problems that users have and we think about the requirements necessary to meet those needs. In the design phase, we generate many different ideas which could potentially solve the problem that was highlighted in the evaluation phase. Lastly, in the implementation phase, we select some of the best ideas and implement them into prototypes. The prototypes help us to get further feedback, which we can then use to narrow down the solution to the most optimum choice. We can apply methods such as user testing and formal inspection as well. This process will lead to the generation of insights, but we may need to repeat the whole process, or iterate, until we can be certain that we have created a product that has a good user experience.
When implementing a piece of code or designing an interface, it can be tempting for the developer to make the product for a type of user, which is exactly like them. However, people vary greatly in their approach to the use of a product, in their expectations, and in their needs. It is very important for a developer or designer to research who the users of the product will be, as well as what needs they have. Designing a product to meet the requirements and perspectives of others, is the key.
UX practitioners usually use three different methods in user experience research. Central to all methods, the researcher will need to figure out who they have to reach. First, the researcher will have to ask questions to the user about their thoughts. Researchers can conduct interviews and surveys. The interviews will involve discussions that will reveal the different experiences. And the surveys will involve questions that are shown to many different people, and will reveal the same kind of information. This research will provide the researcher with insights into user experiences. Second, the researcher will have to watch the behaviour of the users. Researchers can conduct observations, as these will reveal more than the interviews. Observations will involve watching users perform activities, such as watching people interact with prototypes. The researcher can set up user testing, where users can be observed performing scripted tasks on systems. We will delve into the testing process in this section. Third, the researcher can inspect prototypes and other deliverables. The researcher can compare the system to guidelines and principles, in an attempt to find out what rules are violated and where the system is likely to fail. The researcher can also compare the system to other systems, in an attempt to figure out the strengths and weaknesses of the design. These types of research methods will assist the designer to guide the product towards a good user experience.
One of the main methods of UX research is User Testing. During a test, the UX practitioner observes a user interact with a prototype product. The practitioner observes users attempt to perform certain assigned tasks, a real world use scenario, and then collects data on the thoughts and actions of the user as they attempt to navigate towards task completion. This type of testing provides the practitioner with great qualitative and quantitative data into the design, and also user feedback. Usability testing can be broken down into two main types. Either the test is performed on an existing system that needs to be improved, or it will be performed on a system in development that requires more input on the evolving design. By involving users in the process, the designer is reducing risk in the decision making, as the users act as a safety in double checking the approach outlined towards solving the design problem identified. Most important, usability testing will lead to a report with a large number of design recommendations.
As part of testing, the researcher observes a representative set of users attempt to perform tasks on the system they are evaluating. Through observation, the researcher is able to learn what works about the system and what does not work. The researcher can observe where the users have difficulties and make note of incident areas. There are a lot of insights that can arise from observations, and this can lead to the design of a good product.
The UX practitioner needs to make certain types of observations throughout the test. Here are some examples:
Was the product effective at detecting errors?
Was the product effective at recovering from errors?
Are conventions used in the product easy to remember?
How enjoyable was the task to accomplish?
How difficult was the task for the user?
Why was the user unsuccessful in any given step?
As part of the process of observing users attempt to use a system, it is important to ensure that they are not led in the tasks assigned. The researcher must avoid providing the users with clues or tips or insights on how to go about performing particular tasks. The users must struggle to perform tasks and figure them out on their own. The researcher must not lead the users on to how to perform tasks. If there are certain terms in the interface that are part of the task instructions, the researcher must be careful not to use such leading terms, as these will tip off the user on where to go and how to approach the problem. Another interesting point to note about user testing, is the “think aloud protocol”. Users should think aloud, or talk about what’s on their mind, or what they are thinking about, as they attempt to solve tasks. This provides the researcher with information as to the mental processes and the thoughts which users have, as they attempt to navigate the tasks. Otherwise, without having a running stream of consciousness as to the thought process, the observer cannot know exactly what the user is looking at, what they are looking for, what they are thinking, what is the source of confusion, how they are feeling, how they are understanding the presentation and so forth.
Here is a sample to do list of things to go over before, during, and after the test.
Before Test Session:
Check that prototype is ready to be accessed.
Check audio and/or screen recording equipment.
Prepare the script.
Clear any history from previous session.
During Test Session:
Welcome the user.
Request user to sign non-disclosure agreement and sign that they are ok with being filmed.
Provide the incentive.
Start recording device(s).
Summarize the purpose, process and plan of the session.
Tell user that they are not being tested, but the design is.
Encourage honesty and state that it is ok to express criticism and negative thoughts.
Encourage users to express their thoughts verbally as they interact with the prototype.
Explain that the recordings are strictly for the purpose of product improvement.
Ask the users whether or not they have any questions.
State that there are no right or wrong answers.
State that the user does not have to answer something they don’t want to answer.
State that the user is free to leave at any point they wish.
Follow the plan and script.
After Test Session:
students new to UX
students interested in
Stop recording devices and save recordings.
Save the notes.
Review information gathered.
Capturing and analyzing and evaluating a user’s thought is central to the user testing process.
After the user completes the tasks assigned, the researcher should debrief the user. The researcher will have hunches on certain observations throughout the assignment, which can then be clarified during the debrief. Further, any areas where the user may have had difficulty, or may not have completed correctly, are important areas to go over and review. It is better to have a discussion about such difficulties after the task, rather than to interrupt the assignment in the middle. It is not a good idea to interrupt a user in the middle of an assignment. The researcher can probe for more information and resolve questions during the debrief. In addition, the debrief is also a chance to ask specific prepared questions about the product. Examples include:
What is your opinion of the product?
Is there anything you think could be made better?
What is your favourite aspect of this product?
Would you use this product?
The next phase of the process involves a review and assessment of the notes you have made during the test session. During the test, you will have made notes on data such as: whether the participant was successful at the different points within the assigned tasks and what errors were made. There is a lot of data to go through, so patterns need to be identified which can summarize the significance of the data.
The notes made during the test session and the recordings made, will help in the review process. Human memory does not capture the sufficient level of details of events, and that is why we need to take notes and make recordings. Finally, after in depth analysis and review of the usability tests, the researcher will need to write the usability test report. The report will include both the problems that the users encountered, as well as the ideas the researcher presents on how to solve those problems. Specifically, the report should include: a description of the test, a description of the users, findings and recommendations for redesign.
So when we discuss the idea of design in the context of UX, what exactly does design mean. Well most people typically associate the idea of design with appearance or looks. But in the UX context, design is more than that, it’s how it functions. The design is a schematic which shows the arrangement of items such as buttons, forms, graphics and images. Further, it has a goal or a purpose which it attempts to achieve or a problem which it attempts to solve. And lastly, design refers to what something looks like.
Design deals a lot with figuring out what problems exist. Further, the problems must be documented in a detailed and sufficient enough manner, such that it becomes possible to come up with solutions. The detailed documentation allows one to fully understand the problem, and then it is possible to generate ideas or possible solutions. The key is to generate multiple possible solutions, and then to systematically analyze the candidate solutions, looking for the one solution that most fully solves the problem. The most promising solution should then be converted into a prototype for further assessment. While assessing the prototype, new problems may be come apparent, which were not originally defined or noticed at the onset of the process. An iteration is then required, whereby the designer goes back to the beginning. The designer then attempts to outline in a fuller scope the details of the problem, to generate new solutions, and to continue through the same process once again.
In UX design, the design process involves several processes. First, it involves understanding the problem, which means doing research to understand the tasks which users attempt to accomplish. Second, it involves generating possible solutions, through sketching different ideas. Third, it involves analyzing the proposed solutions, through the application of UX principles. Fourth, it involves the creation of a prototype. And lastly, for any new problems that have been discovered, the process should iterate from the beginning to take these new problems into account.
UX Designers create different types of deliverables, which they then share with different stakeholders. Some of these deliverables include things such as: sketches, wire-frames and prototypes.
In UX design, the designer often has to draw a lot of sketches. Sketching is a way in which a user experience designer can describe their ideas in visual form. There are a number of advantages to sketching, including: One, multiple sketches are easy to make, and as such, the designer can refine many different sketches easily. By contrast, a digital design package would be very time consuming to use for the creation of many different sketches. By not spending too much time on any one version, the designer can instead focus on creating numerous concepts. This increases the likelihood of finding innovative solutions. However, if the designer were to use a design software early on, they may improve on the design of the wrong solution, rather than finding the right solution to begin with. Two, sketches usually don’t have a lot of detail. By not focusing on creating too much detail for any one idea, sketches allow the designer to generate many different ideas in an efficient manner. Coming up with lots of different sketches is much more important than illustrating one idea into a detailed masterpiece. Four, it is easy to get feedback on sketches. Sketches allow the designer to take an initial step towards prototyping.
WIRE-FRAMES and PROTOTYPES – A wire-frame is a sketch which shows information structure, functions and the content. It allows one to visualize the “changes of state” or “transitions” within the design, using a very basic black and white sketch. Wire-frames focus on the basics, such as: What information should be present? What is the layout? How does one transition from one item to another? How does one transition through different levels within the structure? The wire-frame will also have annotations, which will be notes on the behaviour of the product. The wire-frame can be made into a prototype.
So what is a prototype? A prototype is an interim deliverable between the design and the final product. Prototypes have several functions. By embodying a design into a prototype, we are able to test the design. By making a design “more real”, it makes it easier to reflect on the strengths and weaknesses of the design and whether or not the design meets the objectives required. Prototypes also allow the team to refer to and share ideas about the design, as well as to provide one another with feedback. In addition, one can do user testing or inspection.
The wire-frame can be made interactive, in the form of prototype, which can be tested with the users. The interactive prototype will allow the team to test how users will interact with the site. In addition, it helps developers to understand the required behaviour of the design. Developers often have a tough time imagining how a design should behave from supplementary documentation or annotations added to a wire-frame. By providing an interactive prototype, the developers can more readily and easily make the mental leap as to what programming models are required to implement the design. Communication is made easier, and consequently, so is implementation.
Heuristic Analysis is an expert UX method in which a practitioner analyses and assesses an interface according to a set of heuristics. Heuristics can be thought of as “professional principles”. If we have a way to analyze interfaces with a set of principles, then it may be tempting to some practitioners to avoid testing the interfaces with users. This is not a good idea! An expert analysis by a UX practitioner will not find the majority of the problems that exist within an interface. Only insight gained through research with users will uncover the majority and hidden usability problems within an interface. However, the heuristics will uncover many problems. Further, the “heuristic analysis” technique can be shared with other team members. Ideally, if a few people on a team were to perform the heuristic analysis on the same interface, many more issues will be uncovered than with only one individual doing the analysis.
There are a few indicators which a UX practitioner should pay attention to as part of the analysis.
Related Heuristic – The heuristic(s) that are related to the observation should be noted.
Description – A description of the issue/observation.
Location – Where the observation occurs within the product or interface.
Frequency – The number of times the problem occurs should be noted.
Severity – The degree of seriousness of the problem from minor to severe.
The most often cited heuristics were developed by Jakob Nielsen and Rolf Molich . They are:
Visibility Of System Status: Websites need to give a visual feedback about the current state or status. Users need to know where they are within the website, as well as the path which they took to get there so that they are able to backtrack.
Match Between System And Real World: The website messaging should be in natural real world language rather than programming terms which are context specific to the site. Only developers would understand the technical language.
User Control And Freedom: Users should be provided with the ability to fix information and undo actions they’ve taken. Users need to feel that they are in control.
Consistency And Standards: Standards must be followed. There must be consistency with the presentation of different services.
Error Prevention: The design should try to detect error conditions, and to attempt to prevent the user from entering into those error conditions, so as to assist the user to not enter into problems.
Recognition Rather Than Recall: The human memory cannot keep track of too many different items. As such, the design should reduce the cognitive load on the users by making as many options and items as visible as possible.
Flexibility And Efficiency Of Use: Users need the ability to customize their experience, especially for frequently performed actions.
Aesthetic And Minimalistic Design: There should be no visual clutter within the interface. There needs to be a purpose for every element within the interface.
Help Users Recognize, Diagnose, and Recover From Errors: Error messages should be in natural and non-technical language, and with a clear explanation as to the fault, and how to rectify the issue.
Help And Documentation: Help information can reduce difficulties that some users may experience.
Introduction To The “User Experience (UX) – Applied Research and Design (+Project)”
We will now present the main steps of a significant design project. Using what you have learned in the course so far, you will be able to interpret, understand and analyze the process displayed by this design project. The project will be presented as a series of “milestones”, from initial concept through to a finished prototype.
We will present a project that displays a solution to a problem outlined in a “design challenge”. The project presented follows a process, presents deliverables, and meets required challenge criteria. The project involves the design of a website. The website may be referred to as a “product” or as a “system” in subsequent discussions. The project doesn’t require any programming implementation, and as such, you don’t need to worry about the need to understand the specifics of various programming languages or other technologies. So let’s begin!
Requirements Of A “User Experience (UX) – Applied Research and Design (+Project)”
The first step in understanding design projects, is to understand that a design project has several requirements. When creating a design project, one needs to understand that it has
a “target population” needs to be defined
know “need(s) to be addressed”
how system will address needs
why system is better than what users are doing now
If you are new to design projects, you could consider gaining some experience by offering small companies who are unfamiliar with solving design challenges, some design services! You could benefit from solving small scale design challenges and you could gain some valuable experience along the way!
“Phase 1” Of “User Experience (UX) – Applied Research and Design (+Project)”
To solve a “design challenge”, some work needs to be done in terms of analysis and research. First, the “target population” and the “problem” need to be defined. Solving a design problem involves figuring out the user population in question, and identifying a challenge or problem to solve. Second, a “project brief” needs to be created. A project brief is simply a description of the essential elements of a project that need to be accomplished. It is simply a document which communicates clearly why the design is required and what goals it will achieve. It also contains a bit of research on attributes of competing systems. Last, a “needs finding study” needs to be designed. You won’t actually conduct the study in the first phase, but the materials to implement the study will need to be developed.
Needs Assessment Study Explained
As a UX expert, you will have a rough idea of what needs current users have, and approximately what kind of system that will solve the problem. It is useful to know what problems to focus on, and to ensure that the problems chosen are actually real problems. UX research process will ensure that the problems are selected correctly and the questions are answered correctly. UX research will provide good answers to the problems discovered.
The best way to start is to talk to some users who may have the problem or a need. Look to find out how they address their needs. Then ask yourself, is it an actual need or an actual problem. How are they going about to meet this need? You need to find out how they solve the problems, in order to be able to develop an idea of whether or not an opportunity to make the process better exists. The more information you can get from the users in regards to the problem and problem solving methods, the more the understanding and support evidence you will be able to put together as to why it is important to address it.
Specifically, two activities are performed during the needs assessment study,; interviews and observations. Interviews are when the researcher asks users questions. Observations are when the researcher watches users perform actions on a system. Common to the UX research process, is to include both the interview and observation as part of one session. This allows the UX researcher to get a view of the needs, but also to see actual examples of the activities, how and why they are done the way they are. Each session should take anywhere from thirty to sixty minutes. The steps involved in performing these activities need to be thought of ahead of time; and then the activities need to be scheduled and conducted.
The UX researcher will need to have some project management skills. The UX researcher needs to plan the recruiting and scheduling strategy for the needs assessment study. How does one find users? How does one know that these users are actually part of the required target population? How will one get in touch or stay in touch with the users? All of these activities requires good project planning, monitoring and execution.
Phase 1 of a UX Research & Design project consists of creating an interview script, where the goals of the study are written down, as well as the questions necessary to satisfy those goals. To make everything clear, we’re going to show you sample design problem definition, project brief, schedule, and needs finding study.
To summarize, as part of the “Phase 1” of “User Experience (UX) – Applied Research and Design (+Project)” –
First, the scope and design problem are explained.
Second, the project brief defines certain metrics;
population – informal “interviews” can be used to help find the specific users
problem – what user needs will be addressed, what activities will be pursued
competitive analysis – looking and researching competitors
improvement goals – how the system will improve things for users
Third, the schedule demonstrates a typical work plan.
Fourth, the needs finding study demonstrates;
goals
recruitment strategy
interview protocol
Now that we’ve defined the first phase of a UX Research and Design Project, it’s time to review a sample Phase 1 report! In the next section, we will outline the project details for a project called “Simplified Investment Interface With Professional Data”. Again, the “Phase 1 report” will consist of three sections; a design brief, a work schedule, and a needs finding study plan. Reviewing the report will give you a good sense of the type of information which must be included and how that information needs to be structured in order to implement a professional UX research project. Now let’s go to the first report!
PHASE 1: Project Details
PROJECT NAME: Simplified Investment Interface With Professional Data
SECTION 1: Project Brief (Design Brief)
Target Users
The management of finances is an essential activity which is central to the operation of every household, and to the operation of every organization. It is an activity which is done by individuals and by organizations. Individuals at the “retail level” invest in securities (stocks). A retail investor is an individual who purchases securities for his or her own personal account rather than for an organization. Anyone can choose to invest in securities (stocks). Retail buyers can include everyone from the 15-year-old buying his first stock to a boss, who carefully reads the financial section of the newspaper and worries about buying what’s “hot” right now.
Professionals at the “institutional level” also invest in securities. Investors include banks, insurance companies, pensions, hedge funds, REITs, investment advisors, endowments, and mutual funds. The project will design a website interface, a simplified stock trading system, for use by the retail investor.
Retail investors invest into equities to; accumulate capital growth for the short term, accumulate educational savings for kids, or to save for retirement. Some retail investors are passive, meaning they are not concerned with the biggest possible gains. The passive investors are likely to go with a professional money manager and invest in a type of mutual fund. Some retail investors are active, meaning they like to perform research regarding their investment decision making. The active investors buy or sell depending on trends and changes in the equities markets. Some retail investors are speculators, meaning they like to scan the market for discrepancies in pricing and under-appreciated assets and look for large money making opportunities. Some retail investors are retirement investors, meaning they invest aggressively when they are young and then they switch over their strategy in the later years towards a passive dividend income producing strategy. For the purposes of our system design project, we will be targeting the active retail investor and the retirement retail investor.
The Users’ Needs That The Plan Addresses (The “Problem”)
The active retail investor and the retirement retail investor has a need to understand how the companies listed on the public stock exchanges are performing. These investors need to be able to quickly compare from a large list of different companies quickly and effectively, so as to figure out the best buying and selling opportunities at any given time and in any given sector. However, in most cases, the investors make uninformed decisions purely based on the news articles from company news releases or from random selection of web articles, and not from professional third party fundamental data which is available.
How The Users Currently Address Those Needs
Institutional investors use various “sophisticated financial analytics tools” and “third party professional data feed subscriptions” to choose their investments. Unfortunately, retail investors must assemble information from a variety of web sources, company websites, third party financial data websites, company financial reports, and bank provided securities reports. The retail investor is forced to piece together a combination of anecdotal and fundamental data from a variety of sources and whatever professional quantitative metrics they can get a hold of, for every single stock. This is a laborious process, because it is time consuming to get an accurate picture of how a company is presently doing, when using multiple sources. Further, it is not just the companies that are held within an investing account that must be analyzed multiple times a year, but also companies which one considers to buy from a large list of company candidates from the stock exchange.
How The System You Design Improves Things For Users (System Goals)
Stockbrokers and professional money managers often look down on retail buyers. Retails buyers are thought to not have any professional knowledge about investing process. The problem with retail buyers isn’t that they want to make a lot of money, it’s that they think they can make more by buying stocks they think will go up fast.
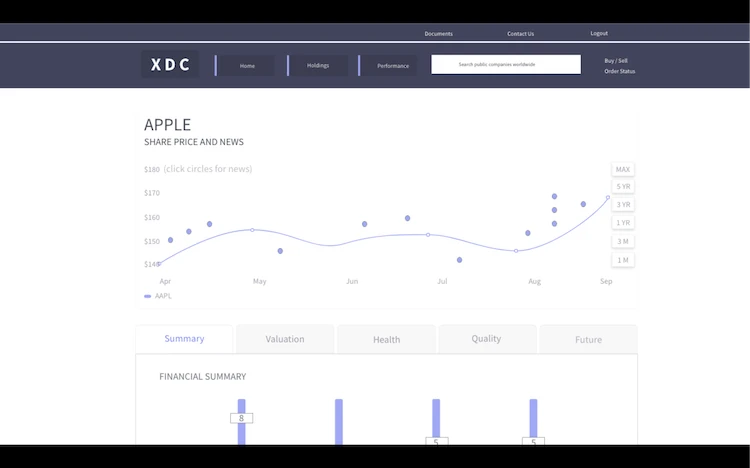
What usually ends up happening is that they buy stocks when they’re pricey and sell at a loss or only a very small gain. By presenting standardized professional securities information within a standard “retail oriented direct investing interface”, retail customers would gain access to a “simplified view” of professional data on the securities they wish to purchase and manage. This would empower retail investors to invest more like their professional counterparts. Retail investors would be able to better and more quickly compare critical metrics of their current or desired securities (stocks) at a glance. This would be more efficient and superior process to the current process of attempting to memorize hundreds of different details from hundreds of different documents associated with dozens of different investments. It would allow retail investors to more easily and quickly check the health, momentum, value, quality, performance and other critical metrics for their individual investments, at a glance. It would allow retail investors to make better trading decisions, and influence a more professional stock picking and management process.
Overview of Competitive Landscape (Preliminary)
In Canada, “Direct Investing” websites available to retail investors can be found at companies such as QTrade, QuesTrade, Interactive Brokers, National Bank, CIBC, TD, RBC and BMO. Located within these web trading interfaces, there are “PDF stock reports” files containing data on the individual stocks available for trading.
Professionals rely on more reliable and more in depth securities analysis data which is available via third party company websites such as: GuruFocus, Stockopedia, Thompson Reuters, OldSchoolValue and SimplyWallStreet. It is our assumption that though most retail investors are aware of the use of direct investing web interfaces for stock selection and trading, they are not aware of the idea that professional stock analysis websites are also available to assist them in securities (stocks) buying and trading. At present, none of the financial institutions offer the option of “integrating these professional data metrics” into their standard investing web interfaces, and this is to the detriment of all retail investors. The design of our proposed website application would bring two important services together; the direct investing interface with the professional stocks data. The competition to this application would be the professional data feed websites, however, as they offer a separate solution that is not integrated into the main direct investing interface, the convenience, efficiency and ease of use is not there.
SECTION 2: WORK PLAN – Preliminary Work Schedule
Phase #: Phase 1, Tasks: Design Problem Details, Project Brief, Work Plan, Plan Needs Finding, Time: 12 hours, Work Dates: April 27th 2019 to May 5th 2019, Deliver: May 6th, 2019
Phase #: Phase 2, Tasks: Conduct Needs Finding, Sketch/Ideate, Personas And Scenarios, Competitive Analysis, Time: 28 hours, Work Dates: May 6th 2019 to May 14th 2019, Deliver: May 14th, 2019
Phase #: Phase 3, Tasks: Wireframes, Paper Prototype, Design User Test, Time: 30 hours, Work Dates: May 15th 2019 to May 22nd 2019, Deliver: May 22nd, 2019
Phase #: Phase 4, Tasks: Conduct User Test, Create Med-Fi Prototype, Time: 40 hours, Work Dates: May 23rd 2019 to May 31st 2019, Deliver: May 31st, 2019
Phase #: Phase 5, Tasks: Heuristic Evaluation, Final Prototype, User Test Design, Time: 40 hours, Work Dates: June 1st 2019 to June 8th 2019, Deliver: June 8th, 2019
Phase #: Phase 6, Tasks: Conduct User Test, Write Report, Time: 30 hours, Work Dates: June 9th 2019 to June 16th 2019, Deliver: June 16th, 2019 (Celebrate)
SECTION 3: NEEDS FINDING STUDY PLAN – Plan for UX Research Study
High Level Goals: What do you want to learn?
The goal of the study is to learn how direct investors go about making their decision to purchase and sell securities (stocks)? The study aims to learn if there are “limiting” or “problematic” aspects to the current trading process on a brokerage. The study seeks to learn whether investors use “third party” professional stock data tools and “professional screening tools” as part of their trading processes, and whether such tools are easily accessible.
Recruiting Criteria And Strategy: This interview protocol was developed to use for four 30 – 60 minute interviews for users of “Direct Investing website” application, seeking to understand what functionality is useful and to examine whether additional functionality would also be useful. Four individuals which are familiar with and have used a standard ‘direct investing website’ for stock investment purposes, will be recruited. The users will be asked the following questions.
Question #1: Are you signed up with a Canadian financial institution for direct investment purposes.
Question #2: Do you actively manage your own stock portfolio with a ‘direct investing’ website?
INTERVIEW PROTOCOL for Direct Investing Website (we will use TD and/or RBC practice accounts).
[Introduction]
Hi, my name is Daryl Oates, and I’m here to understand better how you use “Direct Investing web interfaces”, particularly for selecting and managing your stock portfolio. This interview will take about 30 – 60 minutes, during which time we’ll go through some questions. Throughout, I’d like you to treat me as if you’re describing the situation to someone who isn’t familiar with trading software or direct investing web interfaces. I’m here to learn from you.
A couple of things before we start. To the extent possible, I will take your comments to be confidential. My research team and I will aggregate all the comments from several interviews we’re conducting so that your comments are not easily traced to you. If we quote you in our final report, we will do so without identifying your name or specific role. If there’s anything you really don’t want on the record, even if it’s anonymized, please let me know that, too. Also, this interview is entirely voluntary on your part – if for any reason you want to stop, please let me know. We can end the interview at that point with no repercussions for you of any kind. I can also throw out anything you’ve told me until that point.
Do you have any questions for me? All right, then, let’s proceed.
[Once the interview gets underway…] Oh, and by the way, do you mind if I take an audio recording? This is just so that I don’t miss anything – no one other than the research team will have access to the recording. Thanks.
[Overarching Question #1] What features or information provided within the “Direct Investing Interface” does the participant make use of when selecting a stock for trading (buying or selling)?
[Overarching Question #2] What research or information does the participant consider useful when selecting a stock for trading (buying or selling)?
[Warm up]
How often do you use a “direct investing website” to trade stocks?
Do you feel you have a good understanding of how use such an application?
In general, are you satisfied with using a “direct investing website” to trade stocks over the web?
[Recent use of Direct Investing] I’d like you to think back to the most recent time when you used a “direct investing website” to make a stock trade. Can you tell me a bit about that trade?
[Follow up, if they don’t include in their response]
Where did you perform the online trading?
When did that stock trade take place?
Roughly how long did it take you to place the trade?
Did you perform any research before you selected the stock?
Was all the information you needed about stock available within ‘direct investing website’ interface?
Did you get a price for the stock you were happy with?
[Core Question #1] Think back to the last few times you traded stocks with the “direct investing website”. How did you find the application?
[Follow Up]
Was the application “easy to use” or was it “complicated to use”? What makes the application this way?
What’s your overall opinion of the application? Why?
[Core Question #2] What do you think of the user interface or design layout, and why?
[Follow Up]
Does the arrangement seem to be laid out in a logical or illogical manner? How so?
Are there aspects of the interface that seem “confusing” or “does it all make sense”?
Do you have any artistic or technical concerns?
Does the interface look simple or filled with information? How so?
Is there any feature which you are able to use in multiple ways? Which is your preferred way of using that feature?
[Core Question #3] What features of the “direct investing website” do you mostly use?
[Follow Up]
Do you use the main “Home” page summary?
Do you use the “Accounts” features tab: balances, holdings, activity, performance, gain & loss, …
Do you use the “Research” features tab: Markets, Investments, Tools, Education, …
Do you use the “Trading” features tab: Buy/Sell, Trade Management, Trading Platform..
Do you use “Goals” features tab.
[Core Question #4] Which features are most useful to you and what is useful or valuable about them?
[Follow Up]
What features have you used and what was useful to you?
What features have you not used?
Is there any particular reason for not using certain features?
[Core Question #5] If you can remember, tell me about any instances where you tried to find something, but did not find it? What are those things which you could not find?
[Follow Up]
Are all of the visual components located where you want them to be in the application? If not, how would you arrange the components?
Is there any function which you would like to have, which is not presently available?
[Core Question #6] Can you tell me about what sort of information you use when making a decision to select a stock.
[Follow Up]
What sorts of variables or factors do you consider in your stock selection process?
What do you find is important to know when choosing stocks?
Do you research information on the companies you invest in? If so, how do you go about researching the information and what information do you look at?
[Core Question #7] Tell me about the last time you bought or sold a company?
[Follow Up]
What was the motivation in buying or selling the company?
How did you go about the process of buying or selling the company?
Was there any information that was required in making this decision? If yes, was the information required available within the ‘direct investing website’.
[Core Question #8] What research or information does the participant consider useful when selecting a stock for trading (buying or selling)?
[Core Question #9] Is the need real? Have you ever used ‘third party’ financial apps or ‘third party’ financial websites to get additional information on stocks that was not present within the “direct investing website”?
[Follow Up]
Is there any stock information that you need in the “stock selection process”, that is not available in the “direct investing website”?
Have you ever looked for information from “professional stock data” websites such as: GuruFocus, UncleStock, OldSchoolValue, BarChart, Stockopedia, Thompson Reuters, Simply Wall Street, Yahoo Finance, and Bloomberg. If you’ve used such tools, what’s your opinion of using such tools?
What ‘third party’ financial apps or websites have you used, if any?
[Core Question #10] Do you use “quantitative or numerical analysis/ratios” to select stocks? Or do you use “news style” and/or “anecdotal style” information to select stocks? Or do you use a combination of both?
[Follow Up]
If “quantitative”, what quantitative tools do you use to make securities (stock) selection for trading?
If “qualitative”, what qualitative processes do you use to make securities (stock) selection for trading? (Qualitative means things such as ‘in person investigation’, ‘interviews’, ‘news or web reading’ or ‘talking with fellow investors’.)
[Core Question #11] If you had a choice between subscribing to a “stock screener” or “professional stock data website” separately from your “direct investing” account or having “professional stock data” be included within your “direct investing website”, what would be your preference? Why?
[Follow Up]
Do you reference one or more than one website for financial data on stocks? Why?
Are quantitative tools such as “stock screeners” or “professional stock data” a part of your process? If yes, which service do you use and what elements do you find valuable?
[Other questions]
One of the things that a lot of investors are interested in, are how to boost the performance of stock portfolio returns. I have a few general questions relating to this idea.
[Question #12] Can you think of a specific instance when a stock in your portfolio performed poorly? Did you sell the stock or did you decide to keep it? How did you come to that conclusion?
[Observation]
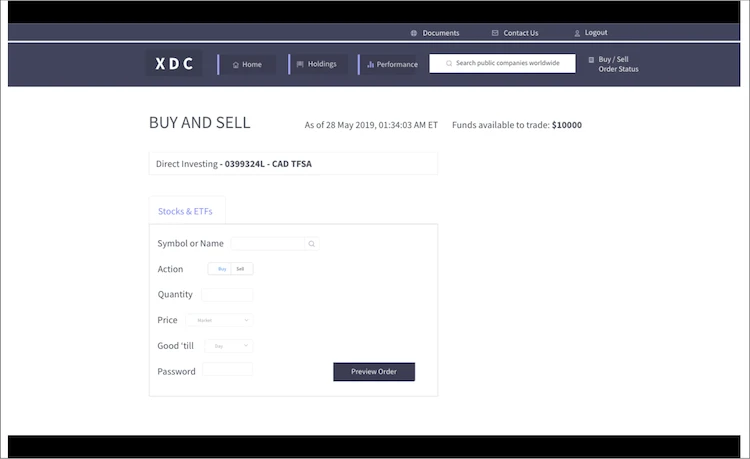
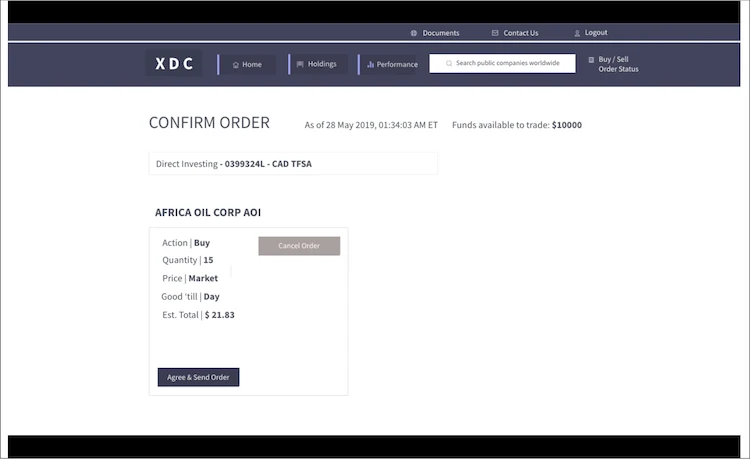
For the next part of this interview, I would like to see how you go about picking a stock for an investment. It is important that this be a new stock, that you do not already own and are not yet familiar with. It is important that you think aloud, and talk verbally as you navigate on the computer, so that I may understand your thought process as you go about in your process of making an investment. Show me how you would buy 10 shares of new stock on the ‘direct investing’ website.
[Conclusion]
Thank you – those are all the questions I have for you. If anything else occurs to you after I leave, please don’t hesitate to let me know by email. I may be in touch with you again to ask a few follow-up questions. If you’d like, I can send a version of the report that we’ll write based on this interview. Do you have any questions?
Thanks again!
“Phase 2” of “User Experience (UX) – Applied Research and Design (+Project)”
Phase 2 of a UX Research & Design project involves doing four steps. The steps serve to support guide the design in a particular direction.
Step 1: Produce Needs Finding Report
The first step involves doing the “needs finding study” which was previously designed during Phase 1. The “needs finding study” provides information about the users and their needs. The study will provide general design ideas and a general concept. From the interviews, observations, and affinity diagramming report, a needs finding report can be produced. Interviewing about 4 to 5 users, should be a sufficient number, and will allow the researcher to find the needs and current practices employed by users. It is vital to record the interviews. Recording the interviews allows the researcher to effectively extract all of the nuanced detail, and then to analyze and organize the data systematically. The data extracted from the recorded interviews and observations can be synthesized according to “affinity diagramming” method.
Affinity Diagramming will allow researcher to discover
user needs
user practices to meet needs
functionality needed
functionality to avoid
Needs Finding Report to include
info on target users
participant descriptions
findings
relevant questions
Did you find any new requirements?
Were there other needs than originally thought?
Did the users face other problems then the problems suspected?
Step 2: Create Design Concept
The second step involves finding solutions that will meet the user needs. One way to do this is through sketching and ideation. Knowing the users, their needs and a basic framework or guidelines for the design, allows one to begin worth in generating possible solutions through broad set of sketches. The key is not to focus on developing high fidelity sketches of the very first few ideas that come to mind, but to be as open minded as possible and generate a lot of diverse ideas quickly. Quantity is Key.
The sketching and ideation process defines possible system displays and interactions. It is important to not get tied down to any one individual idea. Try to ideate or generate many different design solutions.
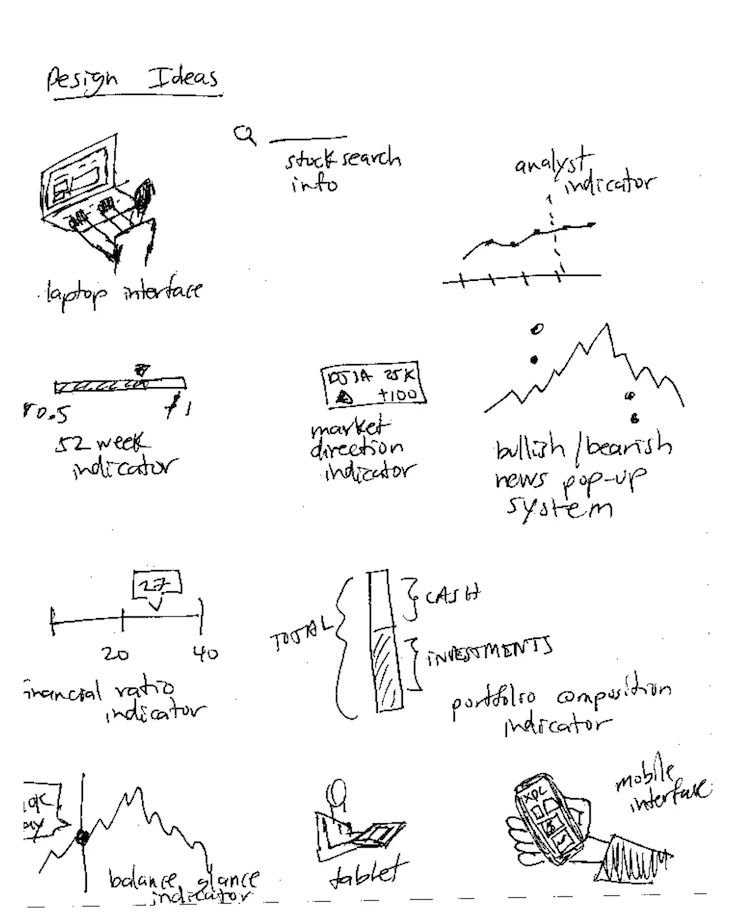
As part of this step, the researcher creates the design concept – initial sketches interaction images – shows user interactions with the design for the key tasks
Step 3: Develop Personas and Scenarios
The third step involves defining personas and scenarios. The personas can assist to help “guide” a design, or to “find a direction” for the design. Personas should be representative of possible users of the system. Personas represent possible users of the design. The personas need to have detail and complexity, or else they will not be useful. As for the scenarios, they will need to show what a successful interaction with a main tasks looks like. Scenarios represent principle tasks of the design. Most design projects will need at least two personas and at least one scenario for each persona. Of course, larger design projects will need more.
Step 4: Develop A Competitive Analysis
The fourth step involves doing a competitive analysis. The competitive analysis involves analyzing the strengths and weaknesses of competing products, competing services and competing systems. The competitive analysis highlights the differences between competitors. The analysis produces solutions and recommendations which can be incorporated into the design.
From a quick search of the internet, it usually becomes obvious that competitors have often come up with solutions to similar problems to the problems you are trying to solve. The goal is then becomes to differentiate your solution, to the solutions already offered on the marketplace. To accomplish this, a competitive analysis is performed which allows the designer to guide the design towards providing a solution that is a little bit different than the solutions already offered. A two dimensional table should be used to highlight competitor differences along the key metrics.
Typically, you want to analyze and compare between three and four other competitors. The analysis helps to shed light on the most useful features, functions, design strengths and design weaknesses of the competitors. The competitor analysis can help to bring forward interesting ideas. You may wish to incorporate some of the competitor’s ideas assessed into your own design!
Now that we’ve defined the second phase of our “UX Research and Design Project”, it’s time to review a sample Phase 2 report! As part of the Phase 2 report, we will continue to develop our research and design project called “Simplified Investment Interface With Professional Data”. The “Phase 2 report” will consist of four sections, including; a needs finding report, design concept, personas and scenarios and a competitive analysis. Reviewing the report will give you a good sense of the type of information which must be included and how that information needs to be structured in order to implement a professional UX research project. Now let’s go to the second report!
PHASE 2: Needs Finding Report
PROJECT NAME: Simplified Investment Interface With Professional Data
SECTION 1: NEEDS FINDING REPORT
INTRODUCTION –The results of the needs finding research study described here is providing essential information for the development of the “Simplified Investment Interface With Professional Data” project. The interviews revealed valuable information that is directly relevant towards the formation of design ideation for the project. In the study, the participants were asked how they go about making their trading decisions, what limitations they face, and what tools and information they use as part of the process. The interviews provided information on not only user interface needs, but also on user data needs and user functional needs. It was discovered that many user needs were not currently being addressed by the “self-directed” investment system they were using.
PARTICIPANTS –As part of the study, four participants were interviewed. As part of the recruiting criteria, the participants chosen were required to have a few months of experience with buying and selling stocks with a Canadian self-directed investment broker. Specifically, experience with the “TD Direct Investing” or “RBC Direct Investing” was required to participate in the study. Out of the four recruited participants, each participant had either used ”TD Direct Investing” as the principal brokerage or had at some point in the past attained some experience with the system. For interview purposes, the “TD Direct Investing” interface was used. Participant 1 was a Musician with low technical expertise. Participant 2 was a Graphic Designer with proficient applied technical expertise. Participant 3 was an Information Technologist with high technical expertise. Participant 4 was a Digital Content Analyst with creative production expertise.
USER NEEDS –As part of the study, several types of user needs were found. First, certain “Pages” received regular use, whereas other “Pages” did not. Second, certain “interface elements” were liked, whereas others were disliked. Third, there was alignment between users in terms of “professional stock data needs”, and it was found that the required information was not available in the trading system. Fourth, key functionality required for effective trading was not present in the system. The user needs discovered in terms of interface, data and functionality, presents the opportunity for the design of new direct investing mode of operation, a “streamlined and simplified interface with enhanced data presentation”. What follows, is a detailed description of user needs.
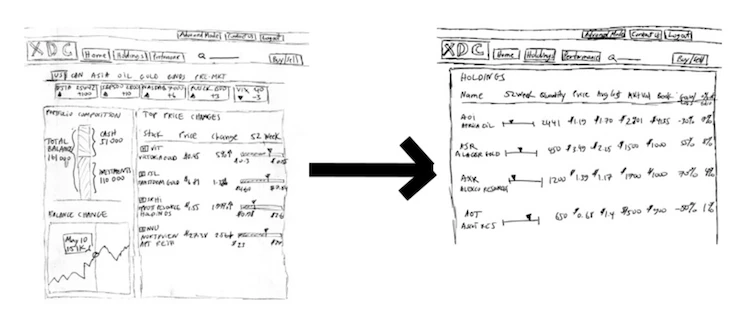
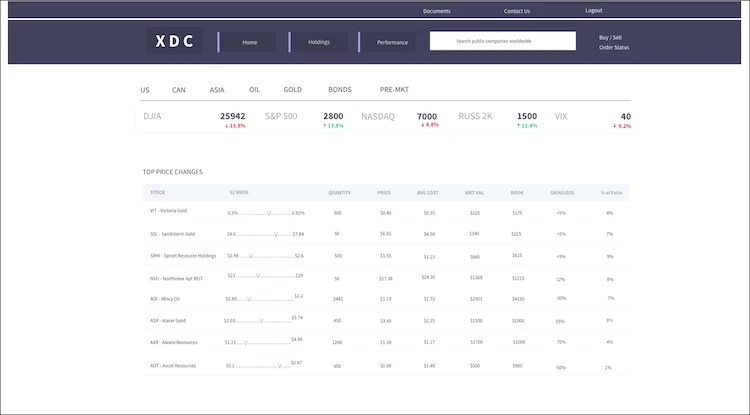
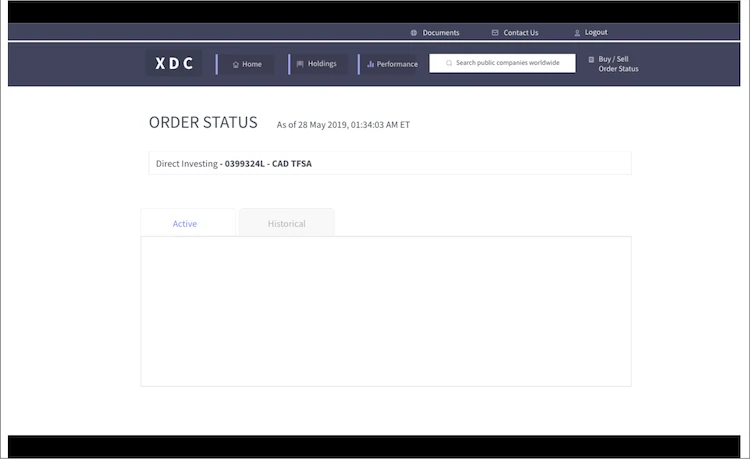
CURRENT PRACTICES –So what are the current practices for the participants, in addressing their trading needs. Participants currently meet their trading requirements by using select, commonly used, main trading “Pages” of the self directed investment system. The most commonly used “Pages” are:
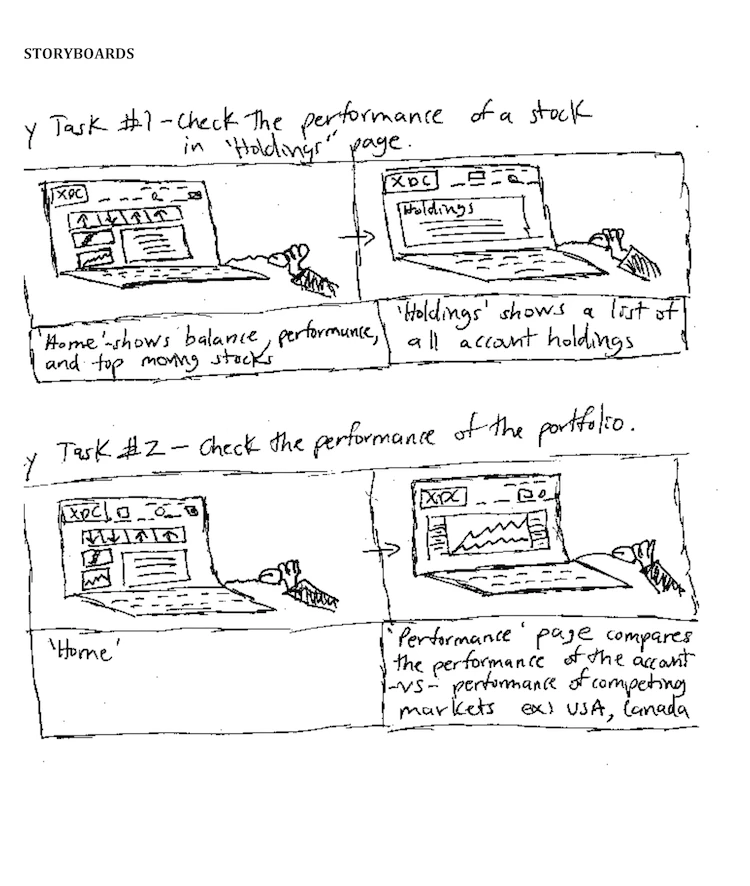
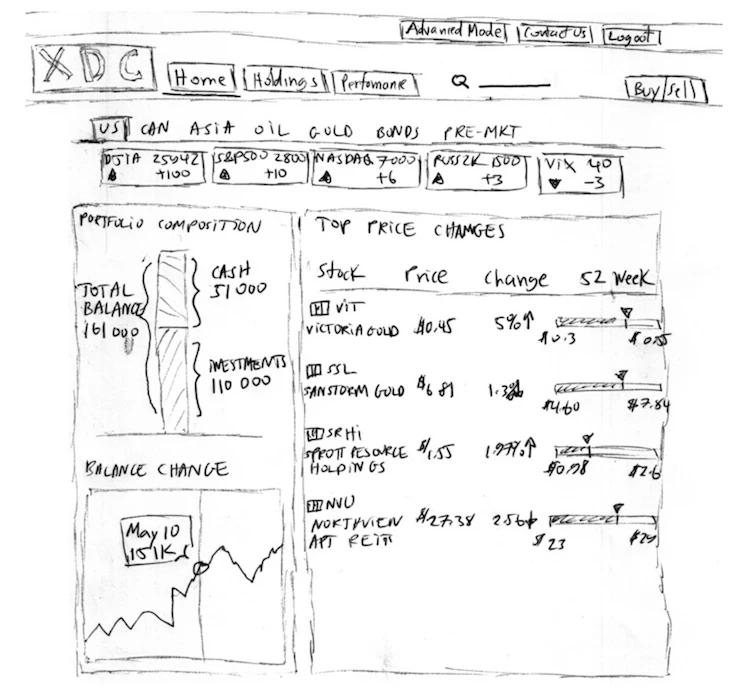
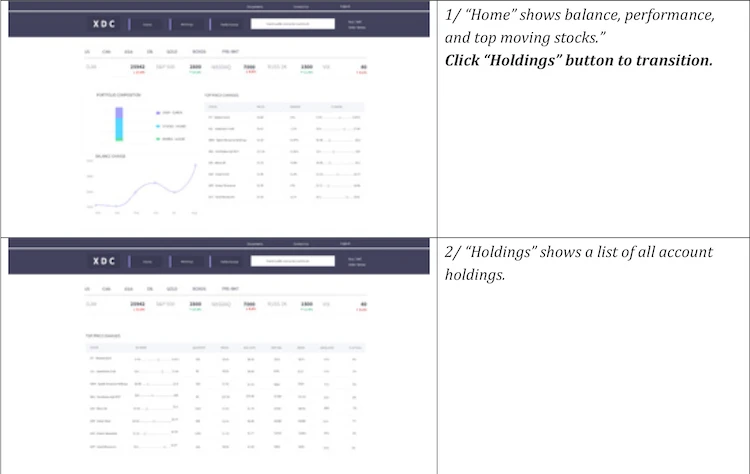
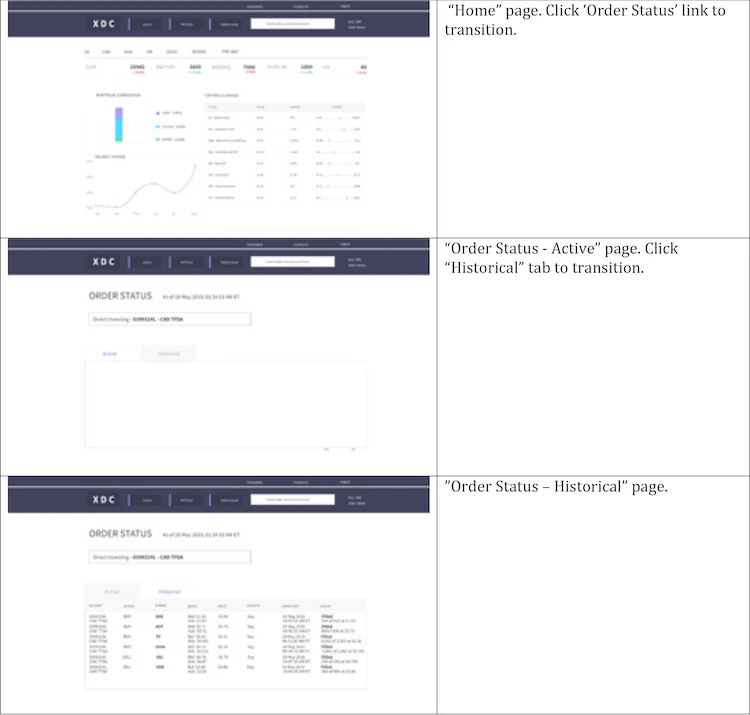
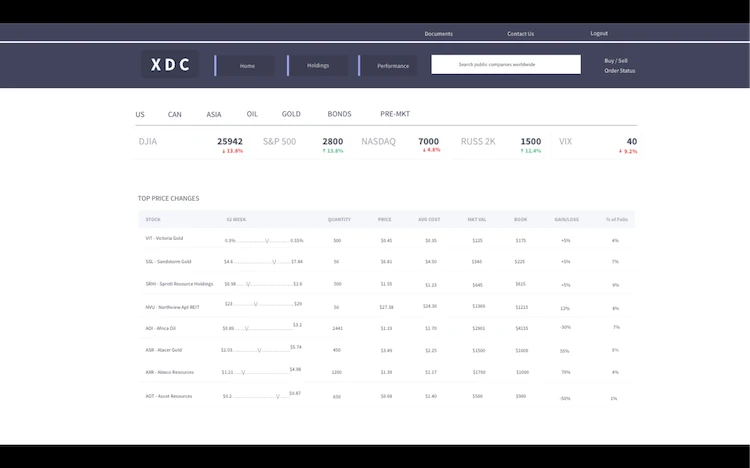
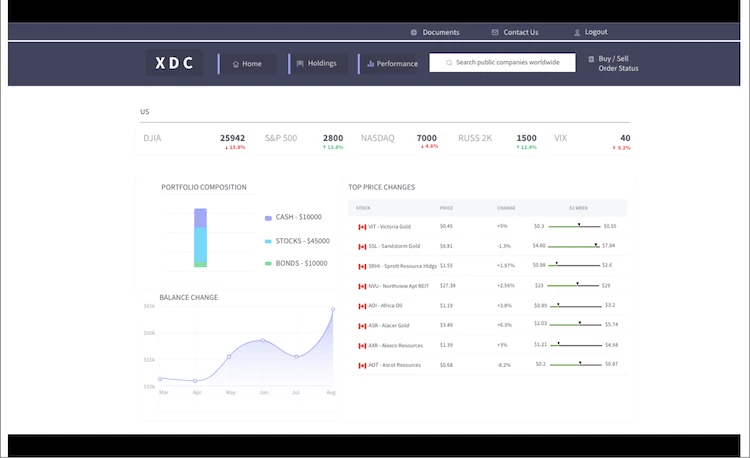
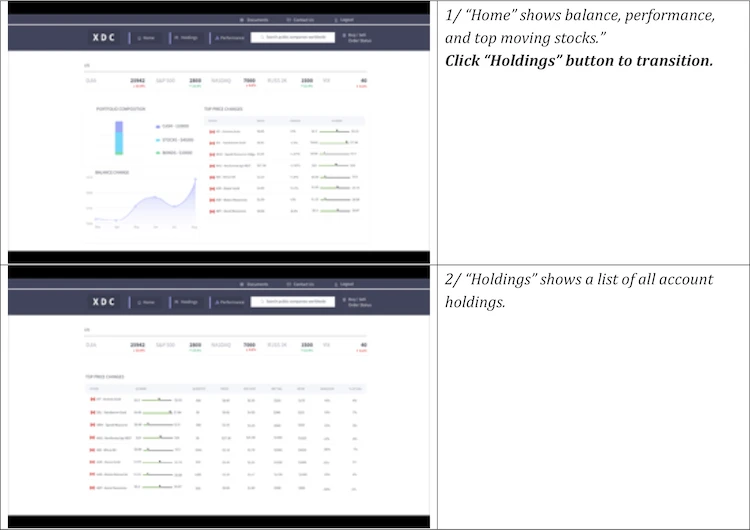
Participant 1 reported using the ‘Home’ page to glance at “Your Top Movers” for significant changes.
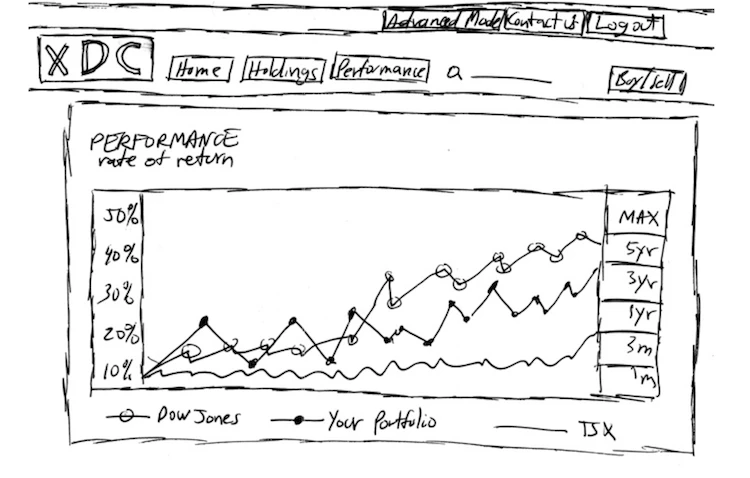
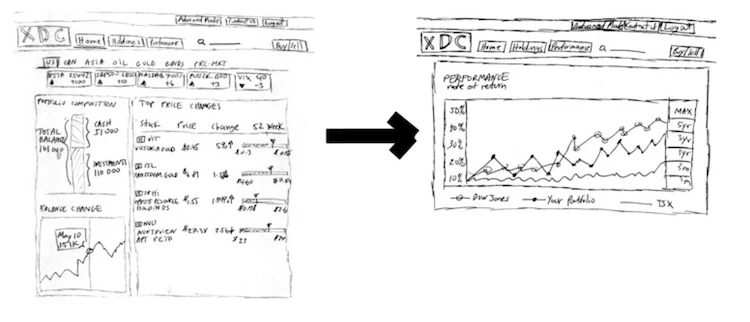
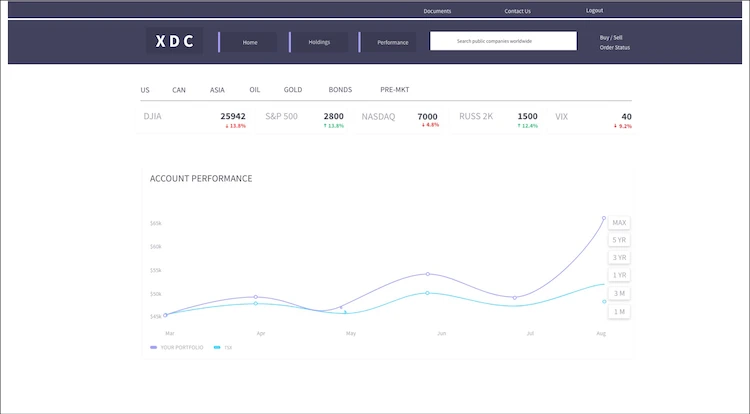
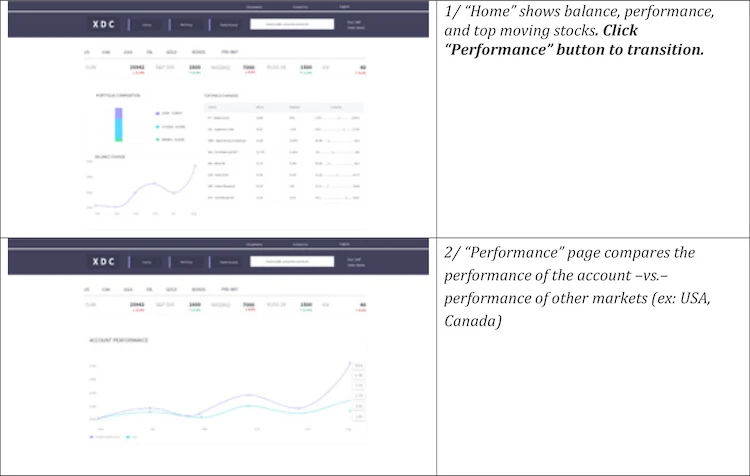
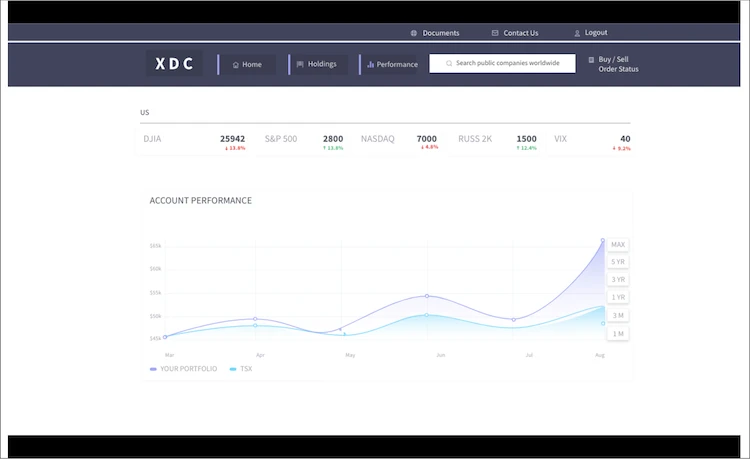
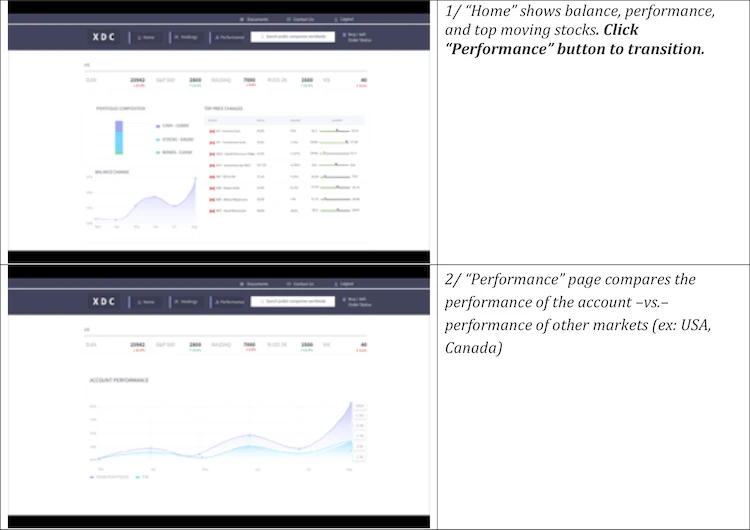
Participant 4 reported using the ‘Home’ page, ‘Holdings’ page, and checking the ‘Performance’ page.
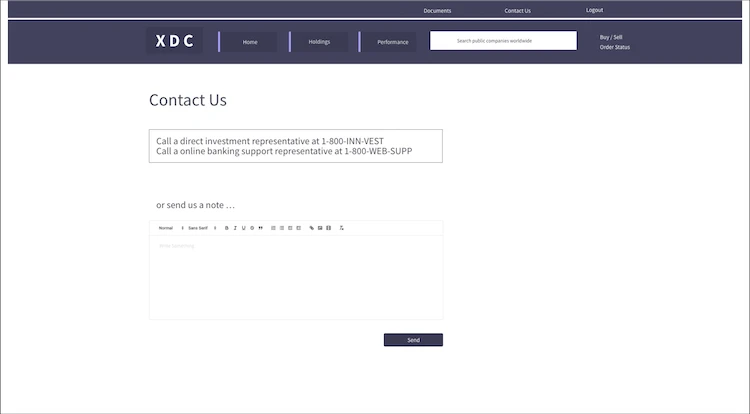
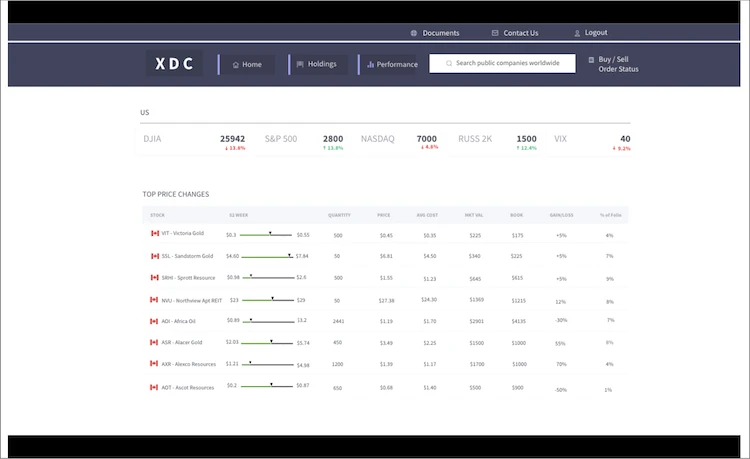
Participant 2 reported using the ‘Performance’ page, and the ‘Alerts’ and ‘Reports’ sections of the ‘Research’ page. The user stated “I don’t seem to need to go to any of the twenty or so possible links in the ‘Research’ page. I only use two features from the ‘Research‘ page. First, I use the built-in ‘Reports’ to find data on individual stocks. Second, I use the ‘Alerts’ feature to set up alerts for good stocks at my desired price point.“ Therefore, in order to satisfy user needs, any design of a ‘streamlined trading interface mode’ will need to at a minimum support the following pages and sections; ‘Home’, ‘Home/Your Top Movers’, ‘Holdings’, ‘Performance’, ‘Research/Alerts’, and ‘Research/Reports’.
CONSTRAINTS –As part of addressing user needs, the participants reported not frequently using certain “Pages” of the self-directed investment system. These are the constraints. To work well and be accepted by the target users, the streamlined design should avoid areas that are unused.
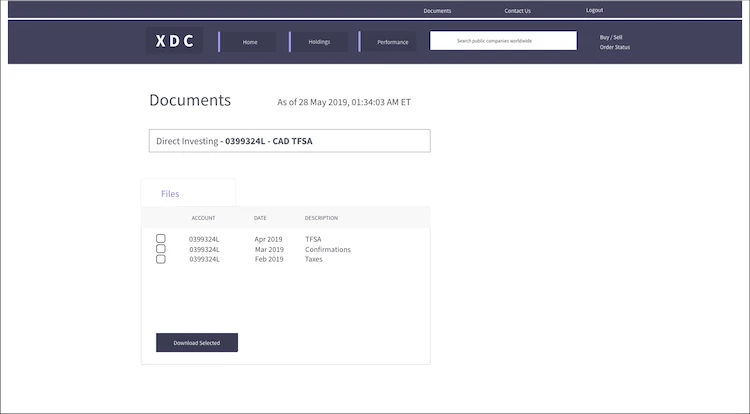
Participant 1 reported that they don’t use any of the following pages, sections or tabs; ‘Products And Services’, ‘Life Planning’, ‘My Accounts’, ‘Market Updates’, ‘Featured Reports’, ‘Events’, ‘Goal Assist’, or ‘Balance’, ‘Projected Income’, ‘Documents’ or ‘Gains and Losses’.
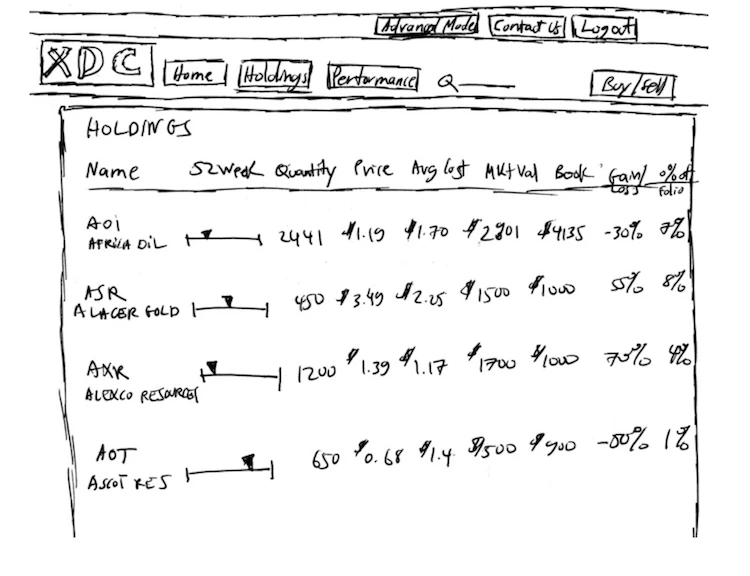
Participant 2 also showed similar patterns of page use to Participant 1. For example, participant 2 also reported not using the pages ‘Activity’, ‘Balances’, ‘Projected Income’, ‘Documents’ and ‘Gains And Loss’. The participant stated “I use only a part of the ‘Account’ menu. I don’t use the ‘Activity’ page or the ‘Balances’ page. I use the ‘Holdings’ page very frequently to monitor the change in stock price from purchase price. I don’t use the ‘Projected Income’ page. I don’t use the ‘Documents’ page or the ‘Gain & Loss’ page. “ In addition, participant 2 stated that the ‘past performance’ was of lower priority and of lower concern than the other metrics, when it comes to making a good trading decision.
Participant 3 stated that the watch-list feature was unnecessary since the ‘Alerts’ feature could be used in a similar fashion to a watch-list, and was a more valuable feature.
Participant 4 mentioned the need for a simple and minimalist user interface, with basic everyday trading choices. The participant stated “I wish I could press a button to get a more streamlined mode of operation that removed all of the unnecessary features“. Then the participant went on to say “There are a lot of interface elements, links, tabs and buttons throughout, which I don’t use.” It seems that though a full featured trading system may be required to cover all contingencies and for power users, throughout the day to day operations of checking of the portfolio and the placement of an occasional trade, the majority of the features went unused.
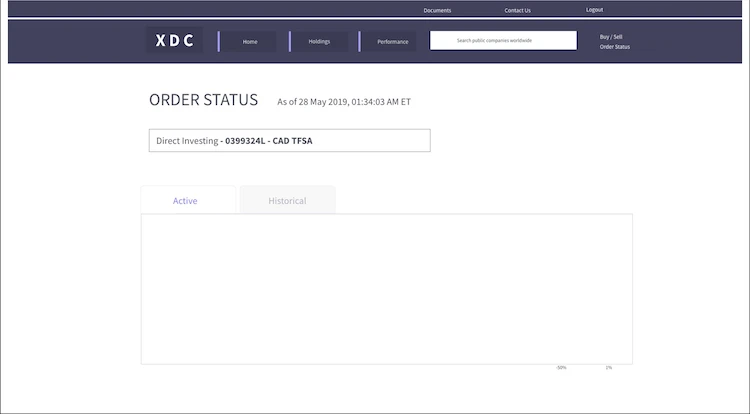
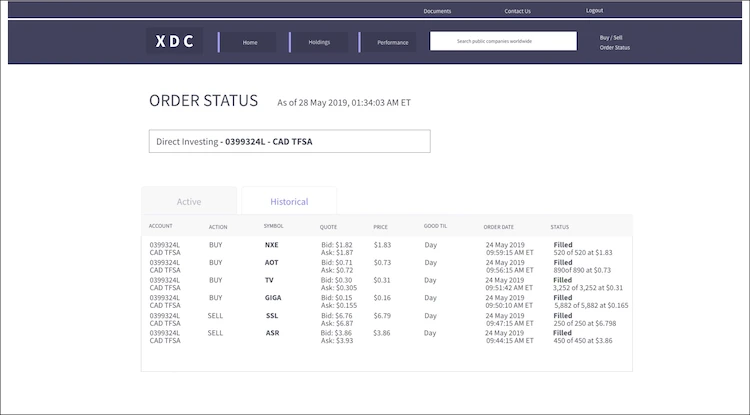
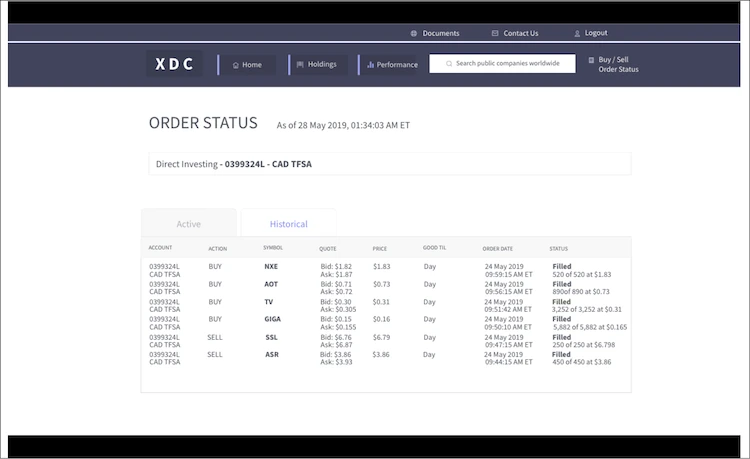
UI ELEMENTS LIKED –In terms of the “interface elements” which the participants liked, the participants reported: Participant 1 reported that they liked that the TD trade execution opened in a ‘pop-up’, whereas on other systems, an entirely new set of pages were loaded. Participant 1 also mentioned that they like having the ability to check the status of the order.
Participant 2 made a comment about the height of the stock entries listed in the “Holdings” page. The participant stated “With ‘RBC Direct Investing’, I had to scroll down a long while to get a look at the stock holdings. The height of each stock entry was too large, making the list long.“ The participant went on to mention that the design of the TD entries, were easy to scroll through, and it made it easy to compare one stock against another.
Both Participant 3 and Participant 4, reported similar trade placement actions. For example, Participant 3 stated “To place a new trade, I start out buy clicking on the “buy” or “sell” button at the top right of the screen. “. Participant 3 also stated “To update an existing trade, I click ‘buy’ or ‘sell’ near the security directly, by going to those buttons next to the security name, under ‘Holdings’. “ Participant 3 also said they liked the ‘Reports’ and the ‘Alerts’ feature.
Further, Participant 4 stated that they like having a broad overview of market movement, as exemplified by the top menu bar where the daily direction of the ‘Canadian’, ‘American’, ‘Gold’ and ‘Oil’ markets can be ascertained.
UI ELEMENTS DISLIKED –In terms of the “interface elements” which the participants disliked, the participants reported: Participant 3 and Participant 4 both mentioned an interest in minimalism and a dislike for multiple small and redundant entries and links across the interface. For example, the “Balances” link takes you to the same location as an alternative option “Accounts” -> “Balances. It was mentioned that such redundancy is confusing.
FUNCTIONALITY REQUIRED –In terms of the “functional elements” which the users required, the participants reported:
Participant 1 had to resort to the use of Yahoo Finance for full screen financial charts, as the charts in the direct investing interface were small.
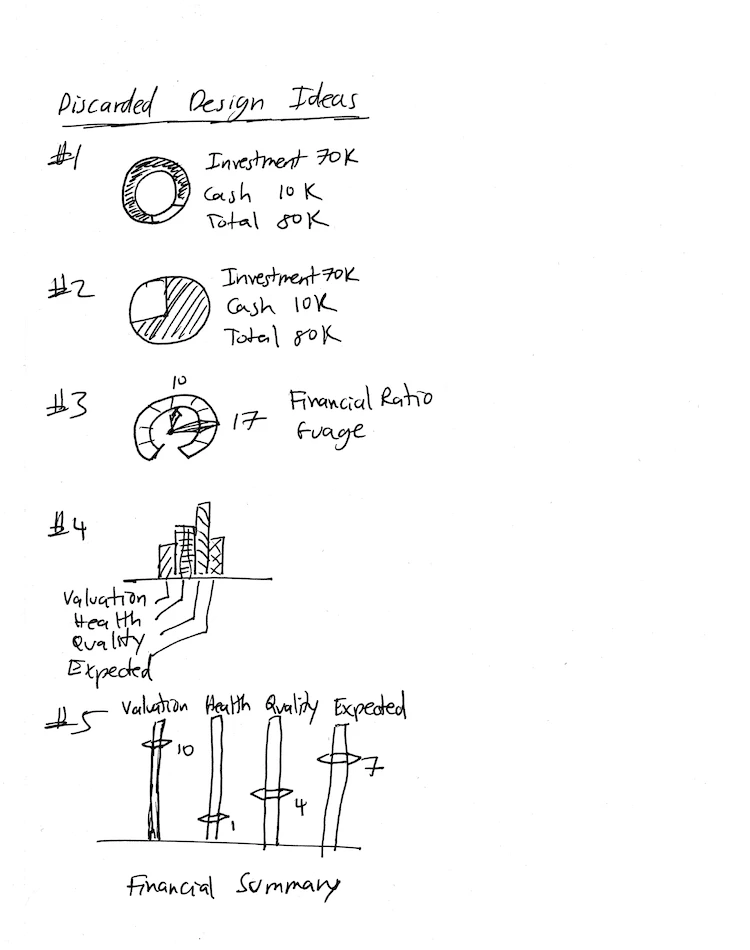
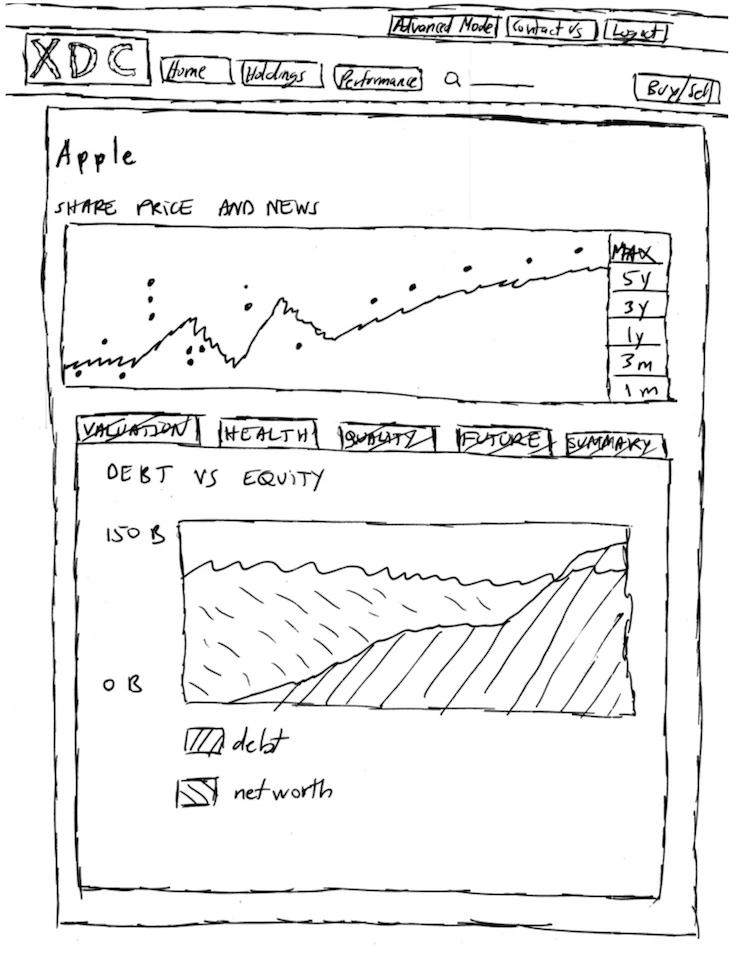
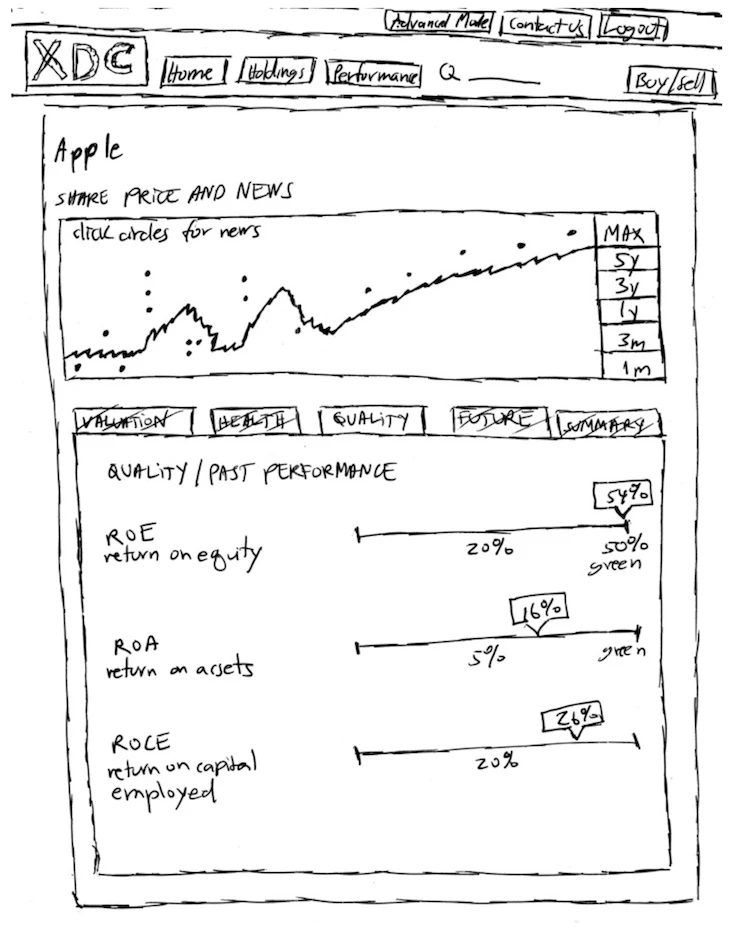
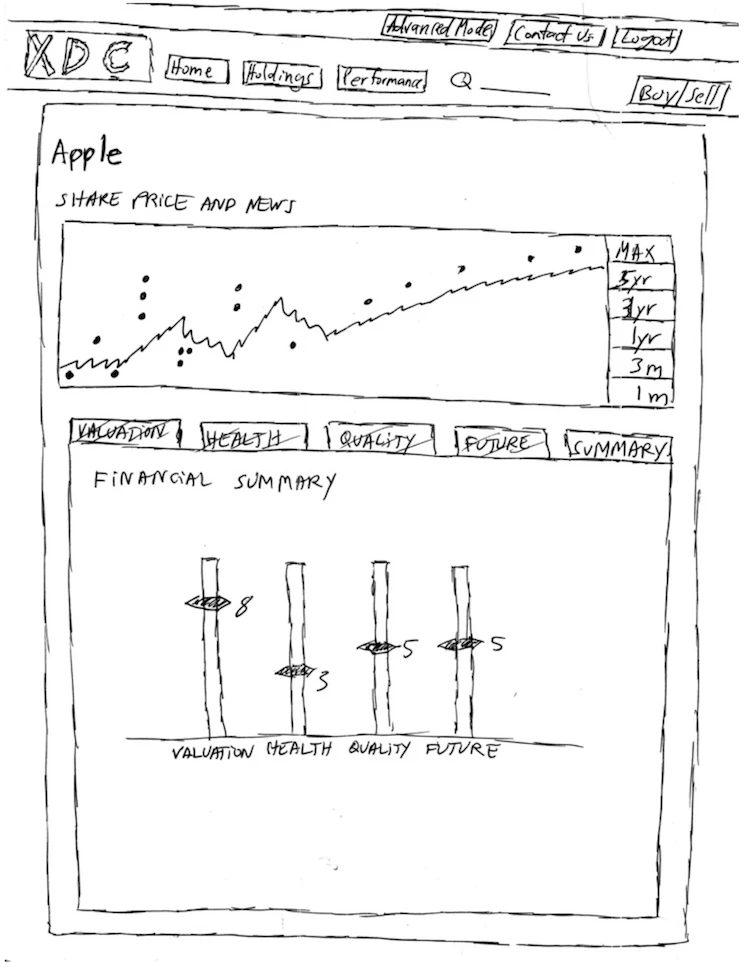
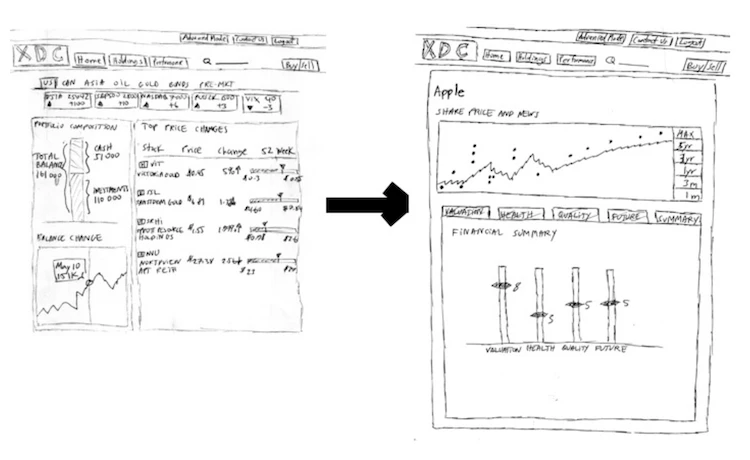
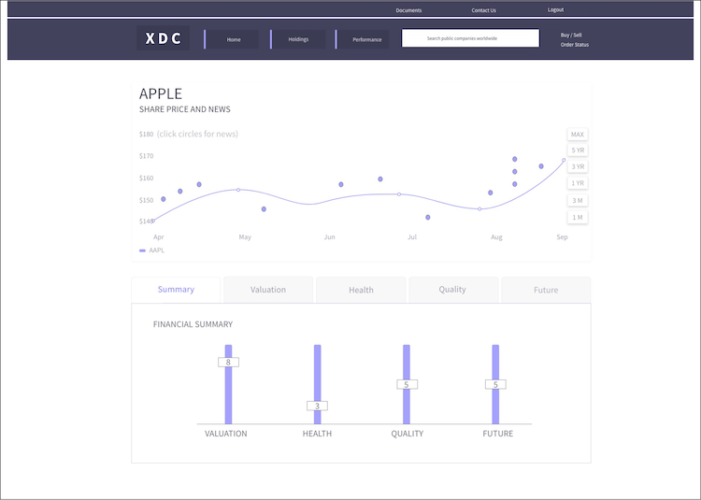
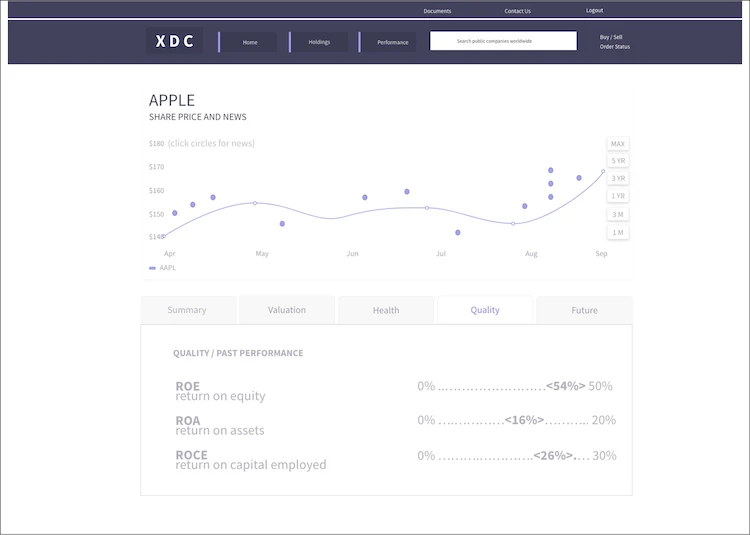
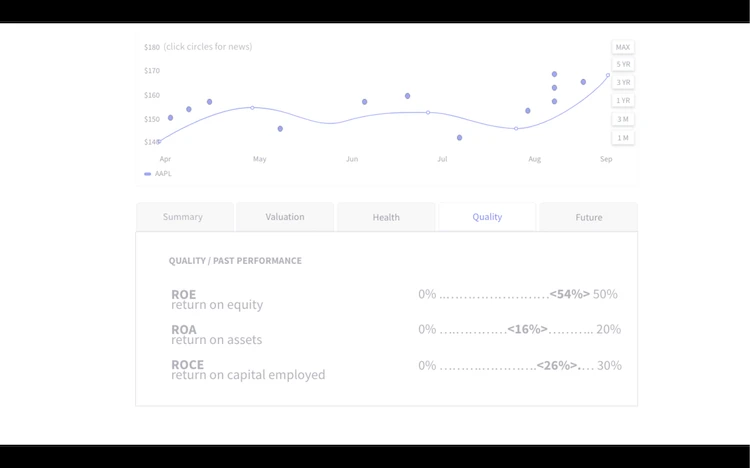
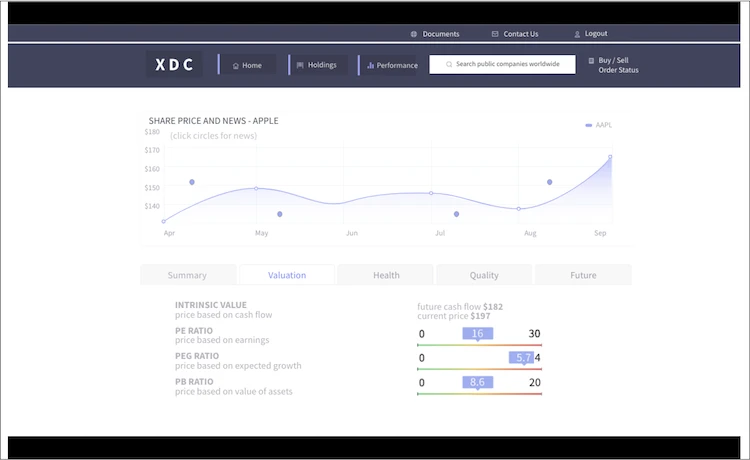
Participant 2 noted a difficulty in using tables and balance sheets from financial reports, to understand stock status. The participant stated “I would like financial ratios and financial balance sheet summaries displayed with shapes and colours, so I can quickly ascertain metrics at a glance. It would also help me better remember and cross compare between different investments.” Further, the “plain” nature direct investing interface did not present stocks with distinguishable and did not enhance memorability. The participant offered a suggestion, to represent “balance sheets’, “financial tables” and financial ratios such as ‘intrinsic value estimates’ with shapes, graphics, colours, and gauges. Similar to the graphical needs of Participant 2, Participant 4 noted that the “52 week range indicator” on the “Holdings” page, would only be understood if it were to be shown graphically rather than numerically.
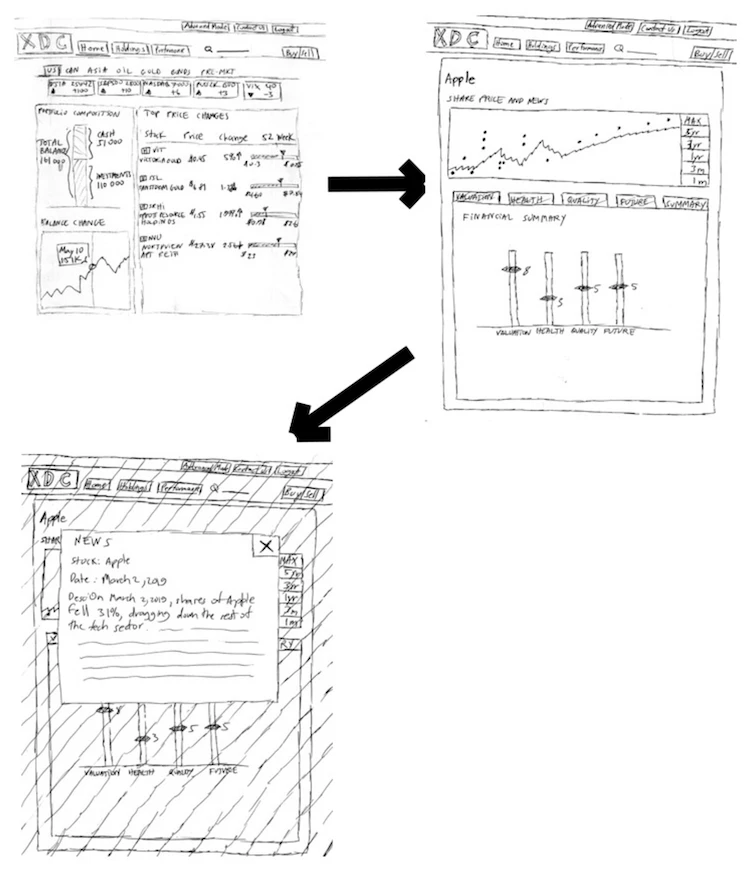
Like participants 2 and 3, Participant 4 also expressed a need for need for a streamlined interface with fewer features like links, buttons and tabs that are not directly related to the main trading functions; but still shown with informative ratios and meaningful graphics. Specifically, participant 4 said “Need informative ratios with real meaning, not tables of numbers, on some 3rd party sites.” Participant 4 also made the observation that the small bits of “News/Events” and “Consensus Analyst” sections presented bits of information that were too small to interpret, under the “Your Top Movers” section.
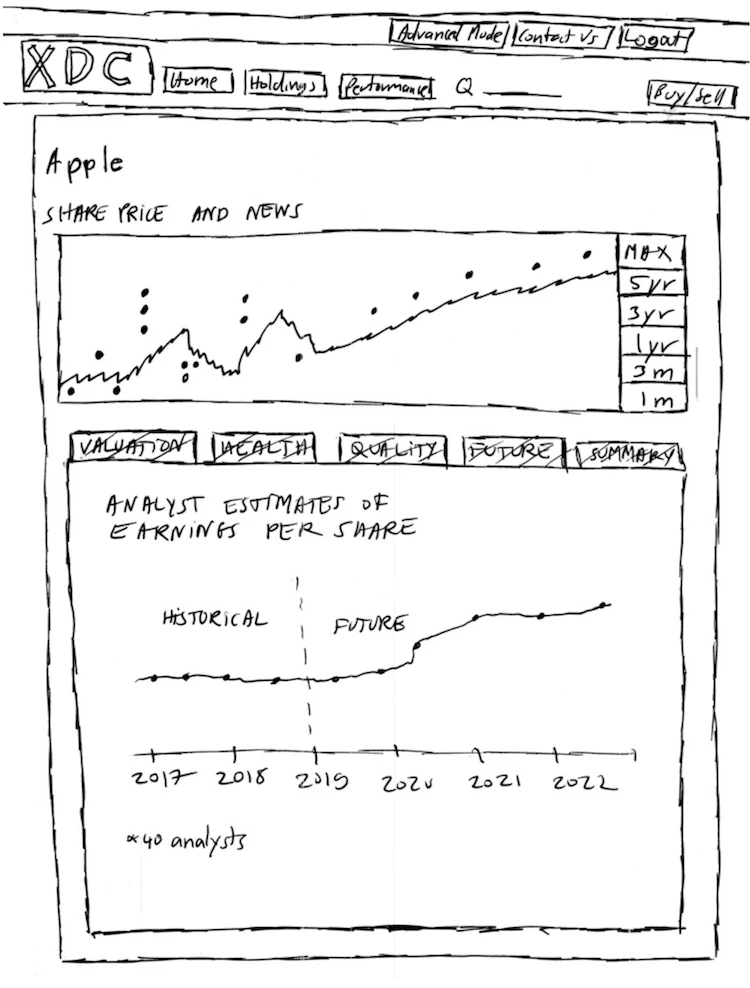
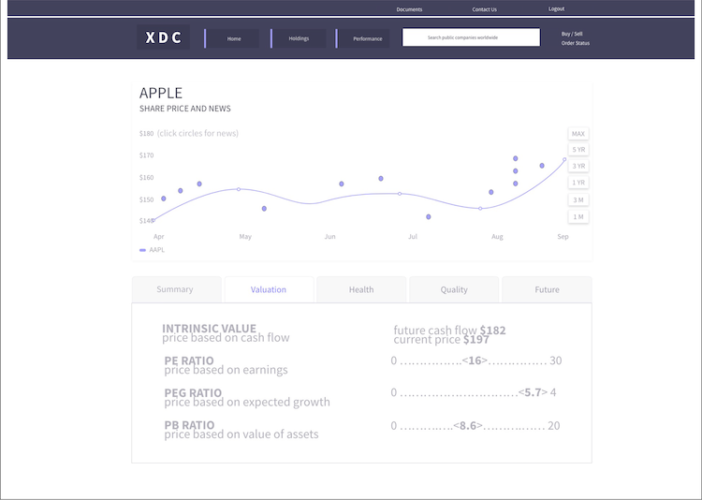
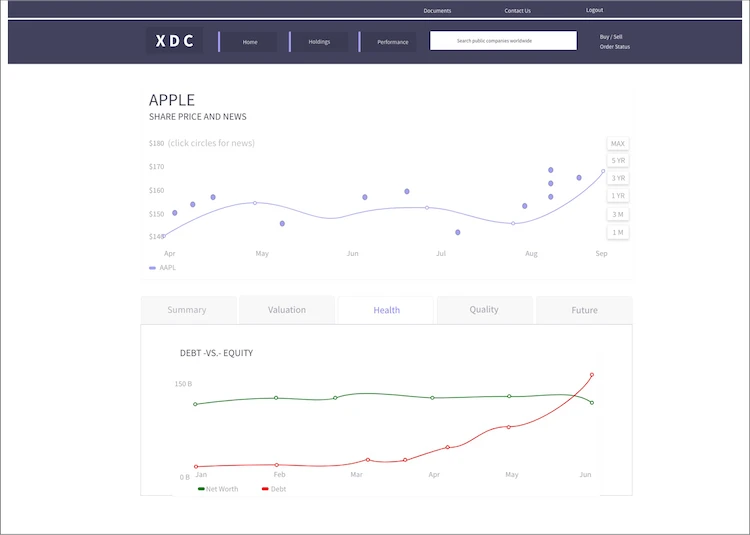
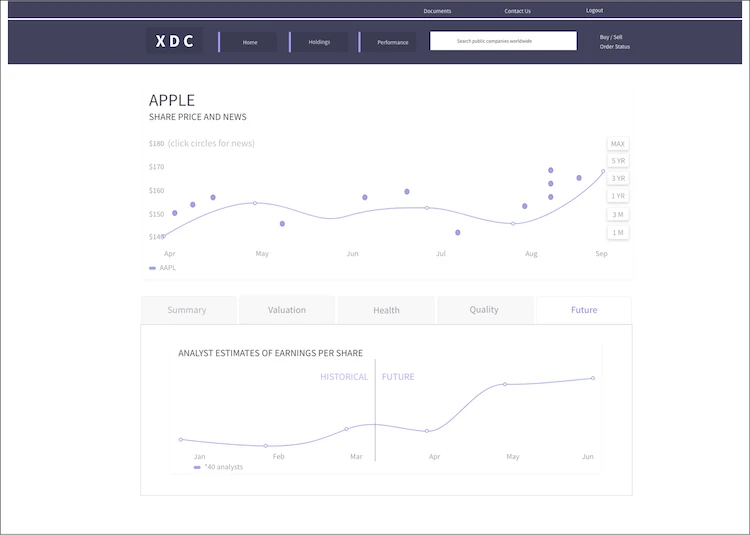
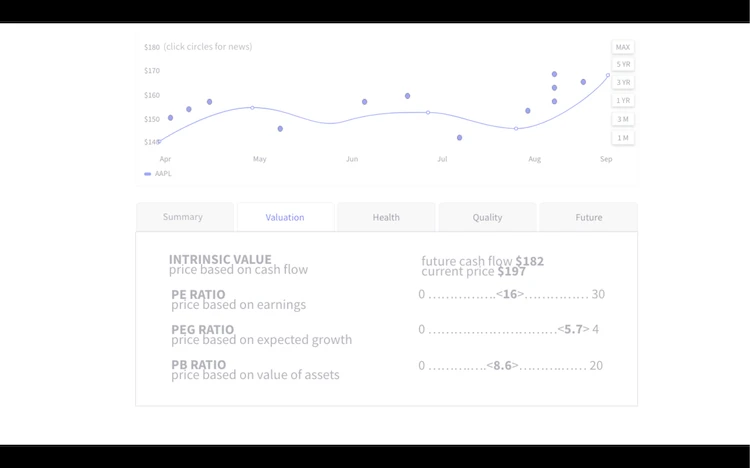
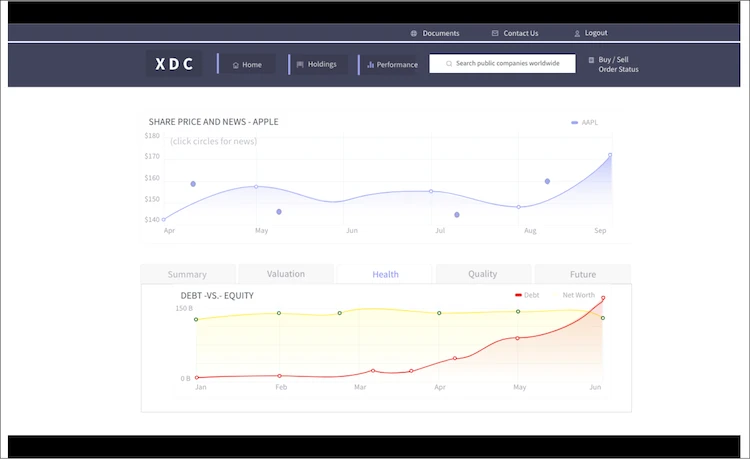
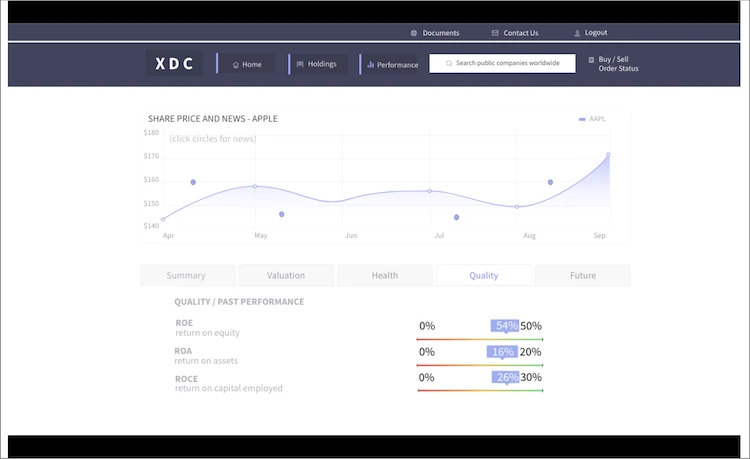
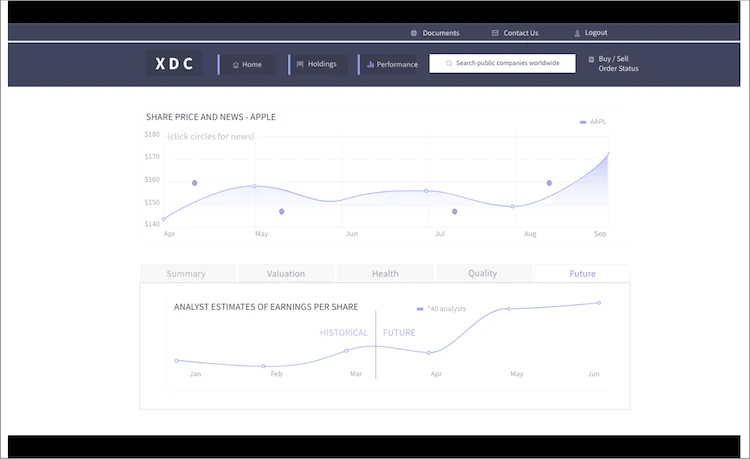
FUNCTIONAL REQUIREMENTS –There were also functional requirements that the TD self-directed brokerage system needed to accomplish to satisfy user needs, but did not do so. The “functionality/stock data” was not available in the direct investing interface: Participant 1 simply wished to know the future price target of a number of professional analysts. Participant 3 mentioned some key points “Data points I need for trading is not available in my brokerage account. I have to look outside of the brokerage system to access fundamental data. I had to use a took called Stockopedia. Now I use something that is less expensive, Simply Wall Street.” and also mentioned “I’ve looked at UncleStock, BarChart, Stockopedia, Simply Wall Street, and Yahoo Finance. I found Stockopedia and Simply Wall Street especially useful. However, I don’t want the additional cost of these services, in addition to the commissions my brokerage fee charges. I simply don’t use all of the data provided by these additional services to make it worth it at this early point in my investment trading. It would help me to have a few pieces of information of Simply Wall Street integrated into my brokerage account. “ These professional tools mentioned were used by the participant to gain valuable insight on important metrics and ratios, such as: earnings, PEG, PE, PB, intrinsic value, quality, return on capital, return on equity, operating margin, analyst estimates, expected earnings, earning per share growth, price to book, price to tang. Book, price to sales, price to cash, EV to EBITDA, cash position, debt vs. equity, and debt vs. net worth. Further, participant 3 mentioned that it would not be possible to create a stock portfolio that is ‘grounded’ or ‘anchored’ to fundamentals without such essential data, data that was not available in the brokerage account. Without key data, it is possible that investors invest all of their capital in stocks which are speculative. In addition, also suggested was the idea of a ‘bankruptcy risk indicator’, to further reduce the risk of investing in stocks which are at risk of single company failure. Last, similar to the approach of participant 3, participant 4 also mentioned that they use external data points to figure out the relative safety and expected performance of their investment choices. Specifically, participant 4 mentioned that they made use of Thompson Reuters Stock Reports+, the Stockopedia and Simply Wall St professional stock data services. Lastly, both participants 3 and 4 paid attention and used the ‘Alerts’ functionality, where pre-selected stocks that had dropped to relative lows would be considered for investment. The only caveat, was that ‘health data’ and ‘fundamental data’ was even more important in this circumstance, again data that was not available in the direct investing interface.
In terms of “pure functionality needs” of a direct investing interface, participants reported:
Participant 1 and Participant 2, both needed quick and daily access to the individual stock reports, but had to navigate several levels into the interface in order to access the reports, for every single stock.
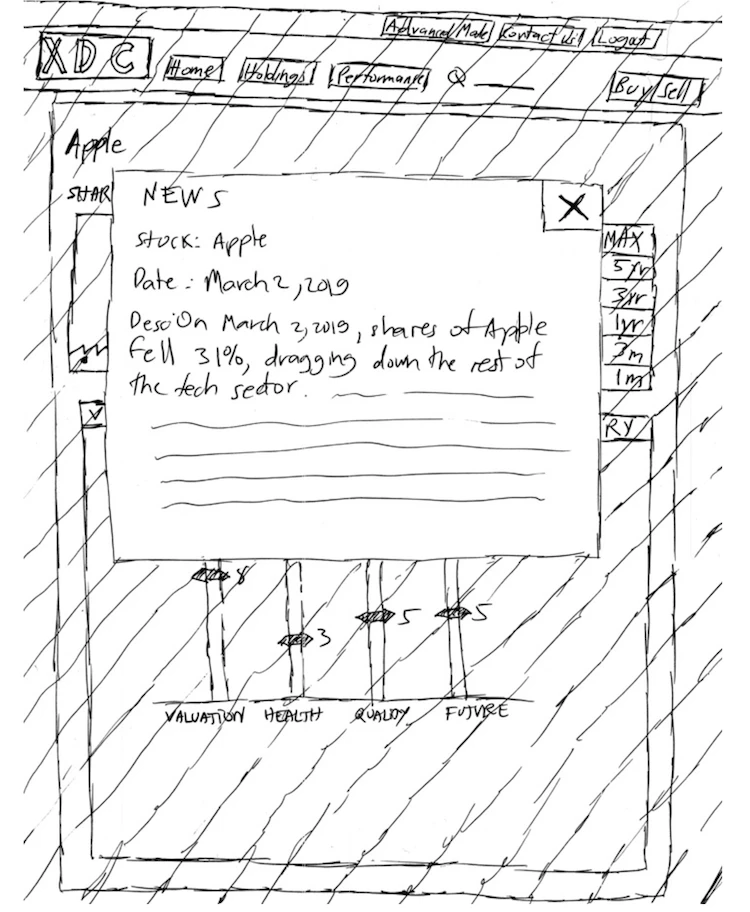
Specifically, participant 1 mention the following need “I wish there was a quick shortcut to the ‘TD Stock Reports’ for the stocks listed on the ‘Holdings’ page. “ Participant 1 and Participant 3 would have also liked a quick access to news at a glance, for every single stock, but that was not available for direct access from the “Holdings” page. Specifically, participant 3 made this comment “I would love to have professional “news article updates” on the individual stocks, which would be accessible from the “Holdings” page. I would like a lot of things accessible from the stock holdings page; such as professional stock trading information, a fundamental data summary, and a news summary. The difficulty with stocks is keeping up with news for all of the holdings, there are many holdings. The tool should help you keep up to date by throwing important news within a quick summary in your brokerage account. Participant 3 also needed a comparison function, to be able to compare stock charts against each other, and had to visit external tools in order to do so. Participant 4 mentioned the need for a ‘summary analysis’ of stocks, both at the ‘stock level’ and at the general ‘portfolio level’.
Conclusion: As part of the study, “interface needs”, “data needs” and “functional needs” applicable to the design were discovered. Further, a focused understanding of design needs was attained. Last, the “data requirements listed” for effective stock selection, in combination with a deep understanding of “most commonly used Pages and interface elements” allows for a relevant and streamlined design to be produced.
SECTION 2: DESIGN CONCEPT
*** This section was omitted because the “design concept” is explained within the “PROJECT BRIEF (Design Brief)”, which was demonstrated within the previous “Phase 1 report”.
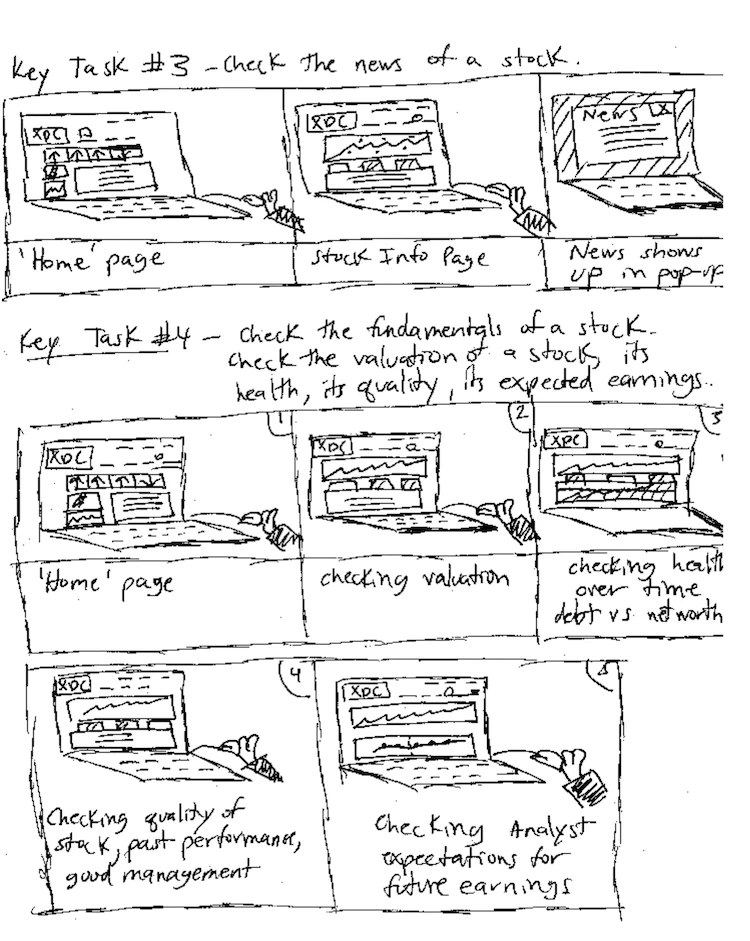
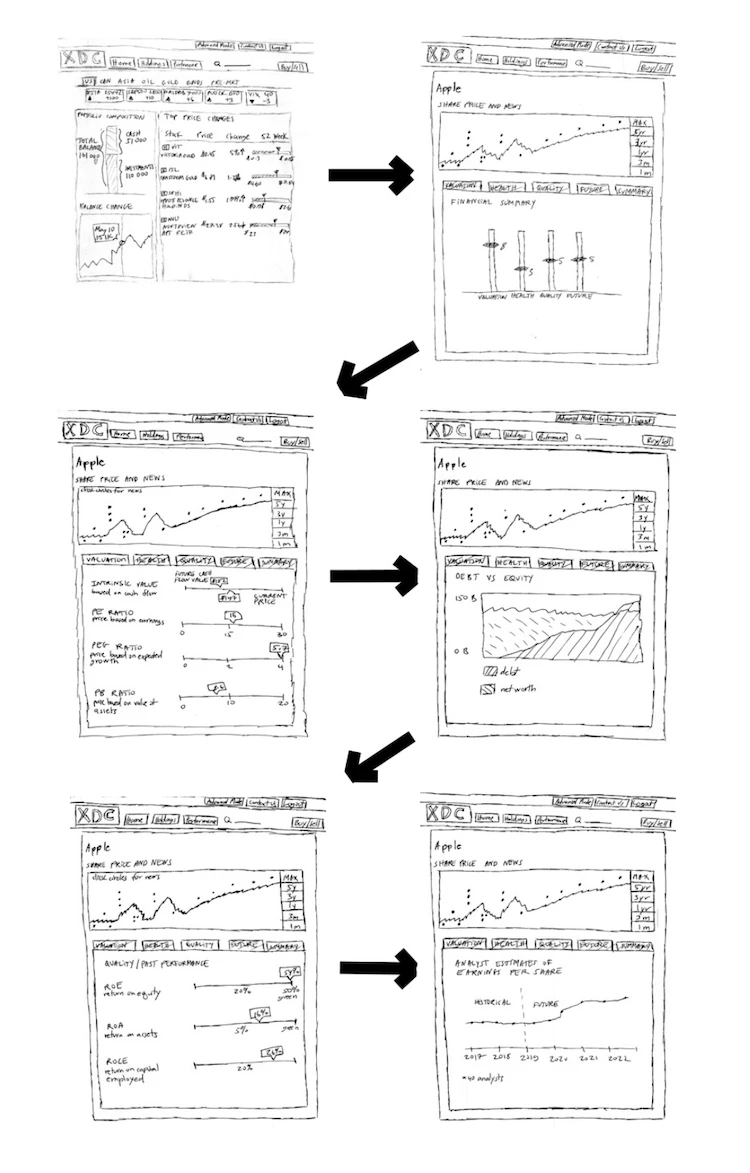
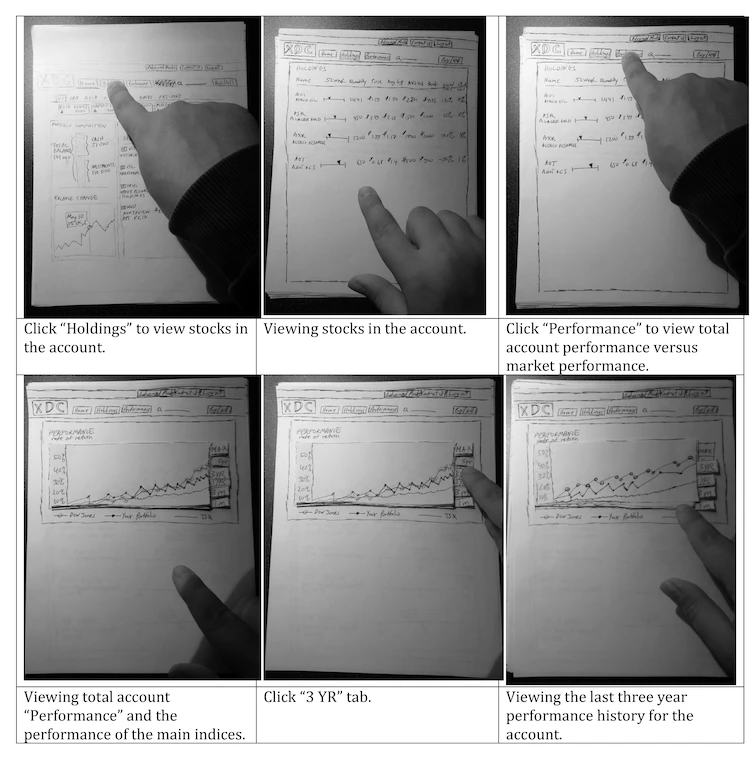
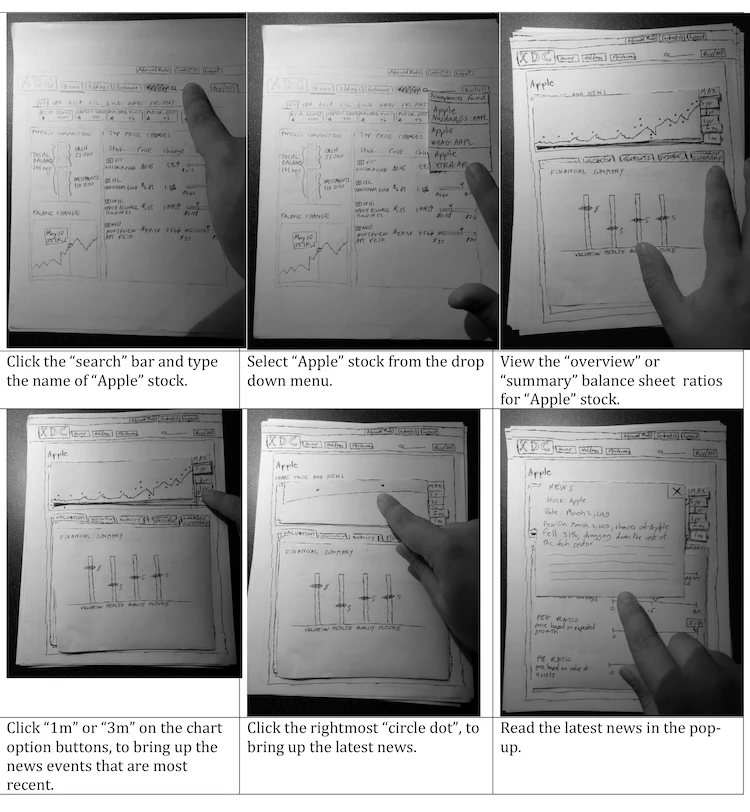
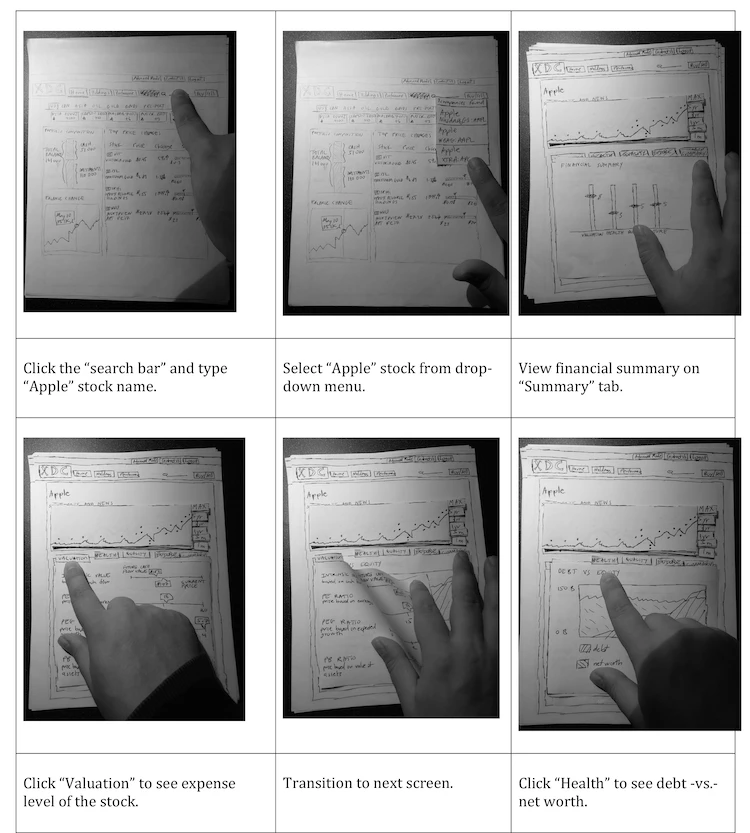
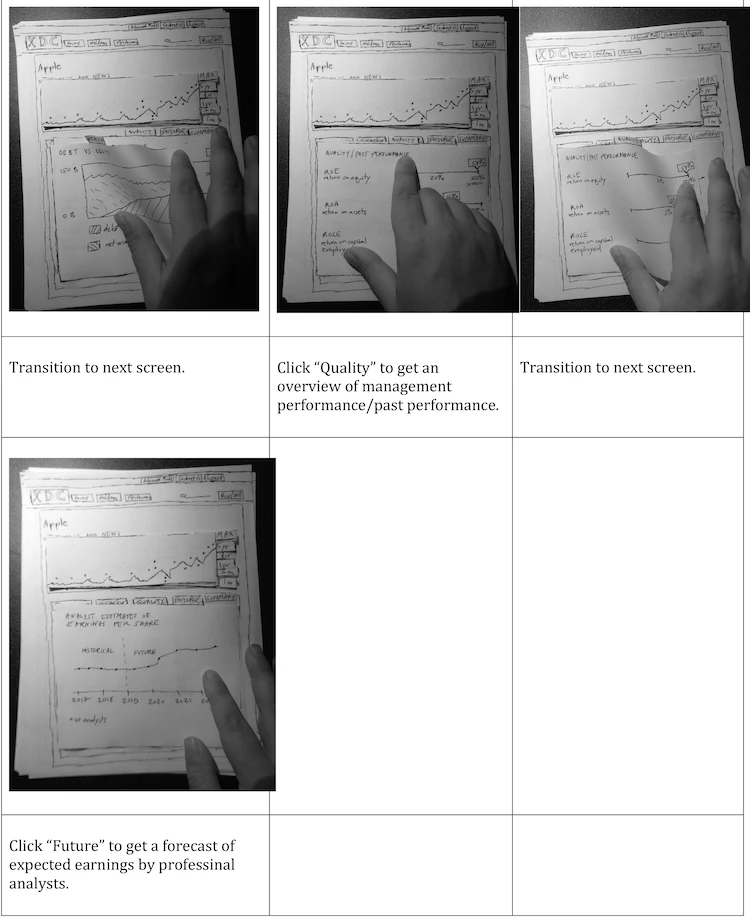
STORYBOARDS
SECTION 3: PERSONAS AND SCENARIOS
PERSONA #1 – Tony
Demographic Information
Age: 25
Occupation: Bachelor of Art student at a University. Student filmmaker who leads and collaborates with others on start-up independent film project endeavours.
Location: Victoria, BC
Life stage: Not in a relationship. No children. No assets. Living at home. Relies on student loans to fund experiences and studies.
Motivations and Needs
Financial Security and Gains – Passion projects consume too much time and money. Is worried for and needs long term financial security for project and for life. Would like financial gains easily, which would prevent the need for a time consuming job. Would like beyond average gains.
Professional Success – Produce a professional portfolio of works effectively so as to demonstrate professional capacity in media production. Would like to be a Director. Would like financial success, which would demonstrate professional success.
Social Contact – Network with new people. Make friends.
Novel Experiences – Have interesting and novel experiences outside of school.
Exploration and Curiosity – Enjoys using new media technologies and learning new creative methods/tools.
Constraints and Barriers
Rural Island Living – Living in a small city on an island limits the size of the media community. It reduces the possibility of “engaging” with arts professionals in a “project” and/or “work setting”. It reduces the work and money making opportunities.
Limited Financial – Has little financial means to hire people for projects and must collaborate with volunteers.
Moderate Time Availability – Tony is too busy with school to have time to effectively organize film project days. But has free weekends and summers to do some film projects.
Limited Ability – High artistic ability. Limited technical problem solving ability.
Life stage: Recently received two professional credentials in engineering and computer science. Has a degree in computer science. Prefers to look for contracts from government. Runs an online business. Doesn’t work a regular job. Not in a relationship.
Motivations and Needs
Fitness and Healthy Living – Staying healthy is essential. A lot of time spent in front of the computer is unhealthy.
Learning – Lifelong learning is a necessity seeing as technology is undergoing an on-going revolution.
Independent – No plans for children due to professional ambitions.
Financial – Need to make money with investments to compensate for the lack of regular and reliable income.
Competitive – Wants to outdo or be safer financially than peers.
Constraints and Barriers
Time Limitation – Learning is very time consuming. Not much time available for work.
Technological Literacy – Deep and broad technical literacy. Both a specialist and a generalist.
Technical Needs – Needs technology to be user friendly and aesthetically pleasing. Needs facts and ratios to be used throughout everyday thinking.
Fitness Limitation – No energy left after time consuming intellectual and web work, to go to regular exercise.
Financial Needs – Strong need for savings accumulation. Helps to relieve global financial fears.
SCENARIO #1 for Tony – Tony, the aspiring independent film director realizes that his passion for filmmaking is taking a huge financial toll on his budget. “I spend so much time on my media projects, that I never get a chance to save any money for my future.” Tony says. Continues to say “Maybe I should spend less, stop the media projects and work part time. Perhaps then I could put some money aside to have even more successful projects in the future, and for retirement.” Tony calls a friend Jones, and hears about all the success Jones has trading speculative junior penny stocks in resources. Tony thinks “Maybe I can do this too. Maybe I can borrow some money from my family, and then speculate on resource penny stocks too, and make money like Jones.” Tony proceeds to do exactly that. He borrows money and opens a direct investing trading account. Everything seems to be going really easy and smoothly. Tony hears from Jones that Zinc is rising fast and Cobalt is key to future battery metals for the new age of electric cars. To Tony, this seems to make a lot of sense. Tony invests in “Trevali”, a leading Zinc producer, and ‘Cobalt 27’, a leading cobalt royalty company. Unfortunately, a few days later, the prices tank and Tony loses about 55% of his savings. It turns out that the battery metal sector was all hype and that the commodities were still not rising, as some investors hoped it would. Tony then realizes that he shouldn’t have based his investment decision on hype and heresay from fellow investors. Tony then proceeds to buy some books on investing, and to listen to professionals from television. These ‘experts’ start to mention and recommend fundamental analysis of stocks, news analysis of stocks, and the general use of information and data to make an informed investment making decision. Tony learns his lesson. Tony realizes there’s a new streamlined mode of operation for the direct investing interface, with some professional data metrics. He switches this mode on. He is pleasantly surprised that he can view the status of the stocks from a new perspective, a perspective with a great summary of the financial balance sheets. Now Tony is able to invest in safe, profitable, and growing companies with ease.
SCENARIO #2 for Donny – Donny, the aspiring online entrepreneur and information technology professional, realizes that he is only getting by with his online business. He realizes that he is not putting anything away for a future time, when perhaps the business will no longer be relevant. Or perhaps his business could one day be replaced by technological progress and/or automation. Donny proceeds to budget monthly, and to put the savings aside into a direct investing trading account. Being technically savvy and proficient with numbers and calculations, he scans the corporate presentation documents on different investment choices. He realizes that those numbers are hard to interpret, and more importantly, it is hard to compare non-standardized corporate presentation documents between different investment choices. Donny proceeds to sign up for professional data subscription services that provide summary financial data and meaningful financial ratios on the individual stock investments. Donny is able to use the financial data provided to compare and make solid investment choices. Donny states “The tool I was using, UncleStock, had over 5000 indicators and other metrics about every stock listed publicly. This was overwhelming, so I stopped using the service. I used Stockopedia for a while, but it was too expensive given that I was just starting out in the investing game. The site also had many features and a lot more detail than I wanted to examine. Last, I tried Simply Wall Street. It had the best visual representations, with charts, gauges, coloured bars and other visuals, but it still required a monthly subscription.” Donny then realizes that the direct investing interface he is using has just released a new streamlined mode of operation with visuals and data ratios included. He turns on the new mode. Every stock has important fundamental data, allowing for an easy comparison between the stocks in his account. He can then easily see which stocks warrant future re-investment, and perhaps, which stocks to sell some shares out of. In addition, being savvy with numbers, Donny realizes it is best to invest at a low, rather than to look back at previous performance, and therefore invest at a high. Being used to working with computers, Donny sets up automatic ‘Alerts’ to alert him by e-mail any time a pre-selected stock drops drastically. Donny receives an e–mail. It’s a ‘Giga Metals’ stock alert. Donny then needs the information on the health, to check if the company is still able to survive such a drastic drop in its share price. Donny no longer needs to log in to external websites for the critical health data. He checks the new streamlined mode of operation for health data, fundamental data and expected earnings. He then invests in Giga Metals, doubling down without a sense that he is risking his money.
SECTION 4: COMPETITIVE ANALYSIS
As part of the selection criteria for “competitors” to the ‘TD Self Directed Investing” service, we did not choose “direct competitors” which would offer similar functionality, feature set, and interface design. The direct competitors would be other financial institutions such as RBC, CIBC, Scotiabank, and BMO. It was the goal of our study to discover, verify and contrast whether or not “similar information systems”, specifically, “professional stock data providers” would be useful to regular investors who typically do not use such third party systems. Therefore, for the purpose of our analysis, we are comparing different types of systems in an attempt to figure out the strengths and weaknesses of the direct investing system as compared to the way information is handled on the professional stock data provider systems.
From the ”competitive landscape”, we learned: This “competitive analysis” comparison matrix highlights the difference between a standard brokerage account, in this case, “TD Direct Investing” and the “third party professional stock data” subscription services/free data services available online. The brokerage system has a lot of functionality to support, and as such, has not been designed to support the display of critical “interface”, “data” and “functionality” requirements which investment users need. The needs finding report showed that users need “precise data points”, “meaningful financial ratios”, “easy to interpret visualizations”, “easy to interpret news”, “information on insider trading”, and “easy to interpret financial reports”. Further, they need this at a quick glance, and within a streamlined and compact presentation linked for easy access near their investment holdings entry. Brokerage interface systems are not there yet, but they could be. Since this kind of necessary investor functionality is available in “stock data information systems”, it would be possible to bring some of this advanced features and functionality into the “brokerage system”. As discussed in the needs finding report, this could provide for more precise and informed trading operations, and therefore it can enhance the user experience.
“COMPETITIVE” MATRIX
System – TD Direct Investing, Stock Chart – Yes , Data (Quality, Value, … ) – No, Meaningful Financial Ratios – No, News – Basic (Hard to Read), Insider Trading – No, Visual (Shapes, Colours, Gauges, Graphics) – Basic, Report – Yes (Difficult to Interpret), Stock Ranking – No
System – FinViz, Stock Chart – (Basic), Data (Quality, Value, … ) – Yes, Meaningful Financial Ratios – Yes (Basic), News – Yes, Insider Trading – Yes, Visual (Shapes, Colours, Gauges, Graphics) – No, Report – No, Stock Ranking – No
Note:The “TD Direct Investing System” is a trade execution system for financial instruments. The “competitors” are not “directly competing systems” as they are “professional stock data systems” and not “brokerage accounts”. The purpose of this comparison is to show the difference in features and functionality between the two different type of systems, and to highlight the differences between the different presentation formats.
APPENDIX
“Phase 3” of “User Experience (UX) – Applied Research and Design (+Project)”
Applied Research & Design (+Project)” consists of developing the design concept to the point that it is ready to be tested with users. The main steps of phase 3 include the creation of wire-frames, the creation a lo-fi paper prototype and the design of a user test. The lo-fi paper prototype simply prepares the project to proceed to the user test. However, the user test still needs to be designed. Only after the design of the user test, can the project move to actual testing, which we will do in phase 4.
Step 1: Create The Wire-frames
Step 1 involves creating the wire-frames. From a design perspective, you want to avoid aesthetic enhancements or graphic illustrations. You want to focus on the presence of key information that is required and on the navigation structure. In regards to the tools to make the designs, you want to create the wire-frames with a digital prototyping tool such as Sketch. They can also be created with a drawing program, or even with pencil and paper. Whatever method is used, the key is to avoid refined design details in the low-fidelity wire-frames. This will ensure that users are not preoccupied thinking about the “illustrative qualities” of the design, or the “low level details”, but instead offer “high level comments”.
The system to be designed may be sufficiently sizeable enough, that it may not be possible to create all of the different possible combination of wire-frames. For this reason, it is best to design the wire-frames for the “most frequently accessed pages” or the “main displays”. The UX professional needs to create the main wire-frames and the main navigation flows. Approximately four to six different navigation sequences will be sufficient in many instances. The wire-frames and navigation flows created should also be used later on in a report to make clear the advancement of the design.
Step 2: Paper Prototype
To create a user test, you will first need to create a physical prototype. The prototype can be created either by “sketching it on paper” or by using a “digital prototyping tool” and printing it out. The next step involves asking the user to perform a set of tasks by navigating through the physical prototype. It is essential to record both “navigation actions” performed by the user, as well as, the thoughts of the user as they contemplate the challenge of accomplishing the assigned task. Ask the user to “speak out loud”, so that you may hear their thoughts as they make decisions throughout the tasks. The easiest and most efficient way to record all of the required information, is to use a tripod in concert with a smartphone. This will allow you to both see the physical use of the prototype and to hear the audio of the running commentary.
The paper prototype needs to be printed out from the digital prototyping tool, drawing program, or simply created from hand drawn sketches. A good number of tasks that a paper prototype can be expected to cover is anywhere from 4 to 7 user tasks. Not every aspect of the system needs to be tested or can be tested in the time available. Additionally, for each task, there can be a few different possible “right” and “wrong” interactions. It may be a good idea to include both the possible “positive” and the “wrong” interactions. The wrong interactions are used to detect any situation where the user may proceed to complete a task in the wrong fashion.
One other key point to remember about paper prototypes, is that they are different than the wire-frames. The paper prototypes are different than wire-frames in the sense that the paper prototype need to be able to display some data that will be present throughout the test. The system needs to be able to generate some data, as well as, the system needs to allow the user to input data as well. A few prototype screens need to be populated with some data for the test.
Step 3: Design A User Test
After the wire-frames and paper prototype have been created, you can design the user test. The “user test planning document” typically contains at least five key items.
an overview of the test
a description of the goals
a description of the recruitment strategy
the specific “task instructions” for the users
a “consent form” signed by the users
The next section will demonstrate the wire-frame creation, prototype creation, and the design of a user test process. A detailed user test plan will be shown. The demonstration will be a presentation of “Phase 3” of our design project.
PHASE 3: Report – Create Wireframes, Create Paper Prototype, Design User Test
PROJECT NAME: Simplified Investment Interface With Professional Data
In the “Key Wireframes” part of Section 1, nine full page wireframes of the “Simplified Investment Interface With Professional Data” project are included. Each wireframe is presented in detail on its own page. For the “Navigation Flows” part of Section 1, five separate key navigation flows are shown, which allow the user to access different types of data.
Wireframe #1 – “Home” Page(“Home” shows balance, performance, and top moving stocks.)
\Wireframe #2 – “Holdings” Page (“Holdings” shows a list of all account holdings.)
Wireframe #3 – “Performance” Page(“Performance” page compares the performance of the account – vs.– performance of other markets (ex: USA, Canada)
Wireframe #4 – “Valuation” Tab (Apple)(The user can determine the expense level of a stock.)
Wireframe #5 – “Health” Tab (Apple)(Health over time. Debt -vs.- Net Worth.)
Wireframe #6 – “Quality” Tab (Apple) (Past Performance. Good Management?.)
Wireframe #7 – “Future” Tab (Apple)
Wireframe #8 – “Summary” Tab (Apple)
Wireframe #9 – “News” Page (Stock “News” shows up in a pop-up.)
KEY NAVIGATION FLOWS
Navigation Flow #1 (Key Task #1) – Check the performance of a stock on the “Holdings” page.
Wireframe #1 – “Home” shows balance, performance, and top moving stocks.” Click “Holdings” button to transition to Wireframe #2
Wireframe #2 – “Holdings” shows a list of all account holdings.
Navigation Flow #2 (Key Task #2) – Check the performance of the portfolio.
Wireframe #1 – “Home” shows balance, performance, and top moving stocks. Click“Performance” button to transition to Wireframe#3
Wireframe #3 – “Performance” page compares the performance of the account –vs.– performance of other markets (ex: USA, Canada)
Navigation Flow #3 (Key Task #3) – Check the “Summary” of the fundamental data for “Apple” stock.
Wireframe #1 – Home” page shows balance, performance, and top moving stocks. Enter stock name “Apple” in the search bar at the top of page. Select “Apple” from drop down menu. Click “Apple” menu option from the stock search drop down menu to transition from Wireframe #1 to Wireframe #8.
Wireframe #8 – Summary ‘tab’.
Navigation Flow #4 (Key Task #4) – Check the news of “Apple” stock.
Wireframe #1 – “Home” page shows balance, performance, and top moving stocks. Enter stock name “Apple” in the search bar at the top of page. Select “Apple” from drop down menu. Click “Apple” menu option to transition from Wireframe #1 to Wireframe #8
Wireframe #8 – “Stock” info page allows user to see performance history, news history, and to access fundamental data tabs. Click any circle on the performance graph to transition to Wireframe #9.
Wireframe #9 – “News” shows up in a pop-up.
Navigation Flow #5 (Key Task 5) – Check all of the detailed fundamental data of “Apple” stock. This involves checking the valuation, health, quality and future expectations of earnings for the stock.
Wireframe #1 – “Home” page shows balance, performance, and top moving stocks. Enter stock name “Apple” in the search bar at the top of page. Select “Apple” from drop down menu. Click“Apple” menu option from the stock searchdrop down menu to transition from Wireframe#1 to Wireframe #8.
Wireframe #8 – Check “Summary” view. This offers a broad overview of data. Click “Valuation”tab to transition to Wireframe #4
Wireframe #4 – Check “Valuation”. Click “Health” tab to transition to Wireframe #5.
Wireframe #5 – Check “Health” (health over time, debt vs. net worth). Click “Quality” tab, totransition to Wireframe #6. Wireframe #6 – Check “Quality” (past performance, good management). Click “Future”tab, to transition to Wireframe #7. Wireframe #7 – Check “Future” (analyst expectations for future earnings).
SECTION 2: PAPER PROTOTYPE
Key Task #1 – Find the performance chart for the “portfolio -vs.- stock indexes”, and set the chart view to a three year time window.
Key Task #2 – Pull up the latest news article shown for “Apple” stock.
Key Task #3 – Inspect the detailed fundamental stock data for “Apple” stock, including; Valuation, Health, Quality, Future and Summary information.
SECTION 3: USER TEST PLAN
1. User Testing Plan for “Simplified Investment Interface With Professional Data”
Test Goals
The goal of this user test is to answer the questions:
Can typical users of “self-directed investment brokerage accounts” figure out how to use the “Simplified Investment Interface With Professional Data”?
What problems do users encounter when trying to look up stock data information on the proposed design?
Recruiting Criteria
The principal audience for this test will be “users who have used and are familiar with online self directed brokerage accounts“. We define our recruiting criteria as:
Has used a “self-directed brokerage account” within the last two years.
Has researched company and/or stock information within the last two years.
Has executed several stock trades.
Test Preparation
Ensure that all of the paper prototype elements, required for the various tasks, are available for testing purposes.
Pre-Test Checklist
Check that you have the stock data “tabs”; Valuation, Health, Quality, Future and Summary.
Check that you have the “news” screen.
Check that you have the “drop-down menu” screen.
Check that you have the “buy/sell” screens.
Check that you have the “market direction” screens.
Check that you have the “stock performance” screens.
Check that you have the “portfolio –vs.- market” screens.
Check that you have the main wireframes; “Home”, “Holdings” and “Performance”.
Check that you have the data wireframes; Apple/Valuation, Apple/Health, Apple/Quality, Apple, Future, Apple/Summary
Pre-test Interview
The goal of the pre-test interview is to characterize the participants’ experience with self directed, direct investing, brokerage accounts.
Have you used direct investing, for stock investing or stock trading, from any of the Canadian banks?
Tell me about the last time you placed a stock trade.
What do you usually use to place a trade?
What is your primary purpose? Is it investing related or trading related?
What is your primary concern with “direct investing” systems you have used?
What information is the most important when you are placing a trade?
How often do you use “direct investing” for “trading” or for “investing”?
Task Instructions And Success Criteria
Task 1 – You have been investing with a new technique for the last three years. You wish to know if your new method of investing has allowed you to outperform the general market indexes for the Canadian and American markets. Find a chart that shows the performance of your entire account, and contrasts it with the performance of the main stock indexes. Once there, set this chart to display a three year time window, so that you can narrow down the comparison to only the time that you were doing this new trading style.
Success Criteria – Arriving on the “Performance” wireframe page, followed by a selection of the “3 YR” tab on the “account performance graph”, meets the success criteria.
Task 2 – The market has recently become very volatile. You are concerned with your sizeable position in “Apple” stock, but are not sure whether to hold as is or sell a part of your position. You decide to investigate. Find and read the latest news that is available for “Apple” stock.
Success Criteria – Success involves searching for Apple stock from the search bar, selecting the correct stock menu option, and finding the “price history chart”. Then, to achieve success, the participant must select the rightmost “circle dot”, on the performance history chart, to bring up the “latest news”.
Task 3 – You’ve listened to investment rumours in the past, and made some bad investment choices. Not wanting to repeat this mistake, you decide to take an analytical approach towards investing. Using your new investing interface tool, you decide to analyze all aspects of the company you are investigating, “Apple”. Find and read the detailed fundamental stock data for “Apple” stock, including; Valuation, Health, Quality, Future and Summary details.
Success Criteria – Success involves the user correctly finding and reading the values listed under the “Valuation”, “Health”, “Quality”, “Future”, and “Summary” tabs for “Apple”.
Task 4 – The market has recently moved down. You realize that some of your stocks will have been impacted, but that this situation may be an opportunity to load up on more shares at a good price. Check the stocks in your portfolio account for losses. “Double Down” on the stock that has the greatest loss since purchase. To put another way, double the amount of shares you own in the losing stock, by buying shares in that stock.
Success Criteria – The stock which is down the most since purchase is Ascot Resources. It is down 50% since initial purchase. There are 650 shares. Success will be determined by a purchase of another 650 shares in Ascot Resources, which would bring up the total amount for the stock to 1300 shares.
Post-Questionnaires: For the post-test questionnaire, we will administer the standard SUS questionnaire on paper.
Debriefing Guidelines:
The focus of the debrief is to walk through any problems that were encountered during the tasks (question #1). If any time remains afterwards, ask higher-level questions 2-5.
Review parts of the test where the user struggled. What difficulties did you have on ____? I noticed you struggled with____, can you tell me what happened? You paused here, tell me more about that.
Preferences. What did you think of the site? What did you like/dislike? Which parts of this page are most/least important to you?
Changes. If you had 3 wishes to make this better for you, what would they be? Why?
Understanding. How would you describe this to a friend?
Use Cases. Under what circumstances would you use this? Why?
2. Consent Form
I agree to participate in the study of “Simplified Investment Interface With Professional Data project” being conducted as part of … “ ….. ”. I consent to the recording of this test. This recording will be used for research and product improvements only. I understand that participation in this usability study is voluntary and I agree to immediately raise any concerns or areas of discomfort during the session with the study administrator. Please sign below to indicate that you have read and you understand the information on this form and that any questions you might have about the session have been answered.
Date:_______________
Please print your name: ____________________________________________________
Please sign your name: ____________________________________________________
Thank you! We appreciate your participation.
3. Logging Sheet
User Test Logging Sheet
Test Name: Logger: Participant ID: Date: Task Number: Task Success:
Clock Time / Event Code / Notes
TASK START
Be sure to log start time for syncing later
4. User Test Script
Pre-Test Checklist
Double Check Success Criteria
Print Task Instructions (one per page)
Print Post-Test Questionnaire
Print Logging Sheet
Print This Test Script
Start Screen Recording
Post-Test Checklist
Stop Recording (save audio and video to backup drive)
File Informed Consent Form
File Logging Sheet
Introduction To “Simplified Investment Interface With Professional Data” project
Moderator: Thanks for coming in today! We’re constantly trying to improve our product, and getting your frank feedback is a really important part of that.
The goal for today’s session is test a prototype we have made for a new stock trading system we are designing. I’m here to learn from you so I’ll ask a lot of questions, but I’m not testing you. There are no right or wrong answers. I’ll start this session by asking some background questions. Then I’ll show you some things we’re working on, and ask you to do some tasks. As you work on the tasks, please think aloud. This means that you should try to give a running commentary on what you’re doing as you work through the tasks. Tell me what you’re trying to do and how you think you can do it. If you get confused or don’t understand something, please tell me. If you see things you like, tell me that too. I want to emphasize that, you won’t hurt my feelings by telling me what you think. In fact, frank, candid feedback is the most helpful.
User Test Script
If you do get stuck, I’m going to try not to answer your questions or tell you what to do. I’m just trying to see what you would do if you were using it on your own. But don’t Worry — I’ll help you if you get completely stuck. Do you have any questions before we begin?
Consent Form
Present Consent form, summarize it, and obtain signature.
Pre-Test Questionnaire
Have you used direct investing, for stock investing or stock trading, from any of the Canadian banks?
Tell me about the last time you placed a stock trade.
What do you usually use to place a trade?
What is your primary purpose? Is it investing related or trading related?
What is your primary concern with “direct investing” systems you have used?
What information is the most important when you are placing a trade?
How often do you use “direct investing” for “trading” or for “investing”?
Task Instructions
Print tasks and present them, one at a time. Read each task aloud and give the printed sheet to the participant.
Debrief
Review – Review parts of the test where the user struggled. What difficulties did you have on ____? I noticed you struggled with____, can you tell me what happened? You paused here, tell me more about that.
Preferences – What did you think of the site? What did you like/dis-like? Which parts of this page are most/least important to you?
Changes – If you had 3 wishes to make this better for you, what would they be? Why?
Understanding – How would you describe this to a friend?
Use Cases – Under what circumstances would you use this? Why?
Conclusion
This has been incredibly helpful. Today, you mentioned… [Moderator: Try to briefly summarize some key parts of the discussion or issues.] Your input is really valuable for me and the team as we think about the next steps for these ideas. We really appreciate your taking the time to come in, and answering all of my questions. Thanks SO much!
[Moderator: Give participant incentive gift, if appropriate.]
5. Post-Test Questionnaire
Answer the following questions based on the scale of 1 – 5 where 1 is strongly disagree and 5 is strongly Agree
I think that I would like to use this system frequently 1 2 3 4 5
I found the system unnecessarily complex 1 2 3 4 5
I thought the system was easy to use 1 2 3 4 5
I think that I would need the support of a technical person to be able to use this system 1 2 3 4 5
I found the various functions in this system were well integrated 1 2 3 4 5
I thought there was too much inconsistency in this system 1 2 3 4 5
I would imagine that most people would learn to use this system very quickly 1 2 3 4 5
I found the system very cumbersome to use 1 2 3 4 5
I felt confident using the system 1 2 3 4 5
I needed to learn a lot of things before I could get going with this system. 1 2 3 4 5
“Phase 4” of “User Experience (UX) – Applied Research and Design (+Project)”
“Phase 4” of the “User Experience (UX) – Applied Research and Design (+Project)” continues the iterative design cycle. The iterative design cycle involves assessing, designing, and building. And then cycling through to do the steps, again and again. This spiral process is evident in the steps that have been accomplished so far. So far, we have conducted a needs evaluation, sketching, and we have built a low-fidelity prototype. The needs evaluation was the assessment step. The sketching was the design step. The low-fidelity prototype was the building step. We have also designed a user test. “Phase 4” involves actually conducting the user test, coming up with design solutions to issues discovered, and then building a medium-fidelity prototype. For this second loop of the cycle, conducting the user test was the assessment step. The design solutions was the design step. The medium-fidelity prototype was the building step. As you can see, the design process is clearly an iterative process.
Step 1: Write User Test Report
“Phase 4” consists involves “conducting user tests”, “analyzing test results” and writing a “user test report”. Conducting user tests requires the recruitment of a at least four users. After the sessions are done, it is necessary to review and document the information from the session recordings. The sessions should lead to the discovery of a few key incidents, from which UX issues and other needs are further discovered. Documenting between five to ten findings, is a good starting point.
Step 2: Create Medium Fidelity Prototype
“Phase 4” also involves the creation of a “medium fidelity prototype” with a digital prototyping tool. The user test should have revealed some design issues. This step involves fixing the issues discovered with the design. A good way to start involves sketching different possible solutions to the discovered design issues. There may be both small and large changes that need to be made, but because we haven’t invested too heavily yet in refining the design, then sketching changes to even large things such as structure and architecture should still be easy to implement.
Creating a medium fidelity prototype will allow you not only the opportunity to enhance the detail of the prototype, but to expand the functionality of it as well. As part of creating the medium fidelity prototype, you could add more support for different tasks that users will need of the system to be able to support. As the design process progresses, more ideas of missed functionality may become obvious, and the creation of the medium fidelity prototype affords you the opportunity to add in support and thus making the system more feature complete. You should also think about where users are likely to make an error, and if possible, include “error detection and recovery displays”.
A medium fidelity prototype needs to be interactive. This means that it needs to be clickable and navigate able. Though the graphic design or illustrations do not need to be picture perfect, the content itself should have some colour, basic fonts, sample text and sample images. Though the user needs to be able to navigate through the different screens, that doesn’t mean that the system needs to support a database. In fact, the software itself does not need to be implemented, it just needs to offer a view of how the system would look.
The medium fidelity prototype should be created with a software prototyping tool. Some tools offer good support for low fidelity, other for all levels of fidelity, and still others focus mostly on producing quick high fidelity. The tool you choose, is up to your best and most informed research decision. There are a lot of options to choose from, so we will not delve into the specifics of ever changing software within this course. Last, though the digital prototype will eventually need to be interactive and clickable, this isn’t a strict requirement yet for this particular phase. However, you will eventually need support for this functionality for when it comes time to create the high fidelity prototype.
The next section will demonstrate a user test report, a med-fi prototype, task flows and an appendix with raw questionnaire responses. … The information will be a presentation of “Phase 4” of our design project.
PROJECT NAME: Simplified Investment Interface With Professional Data
PHASE 4: User Test Report, Med-Fi Prototype
SECTION 1: USER TEST REPORT
Executive Summary
This document is a “User Testing Report” for user tests conducted on the “paper prototype” designed in “Phase 3” as part of “Simplified Investment Interface With Professional Data” project. For this “User Testing Report”, five user tests were assessed. The five user tests consisted of live user test sessions, along with the analysis components.
The user tests revealed that the product needs only a “light” amount of work to address the different technicalities which obstruct the flow of user action in the stock research and stock trading execution process. The “paper prototype system” analyzed, enables the users to research detailed fundamental qualitative and quantitative data on publicly listed securities, and then to execute the required trades. However, there are “a few” difficulties which the users face at a “low” and at a “medium” level of severity, and these “difficulties” or “bugs”, sometimes prevent the users from achieving their tasks correctly or simply from achieving a good experience with the system. Though users can perform what is needed with the “paper prototype system” in its current form, optimization is required to ensure a smooth and non interrupted flow where users can more quickly and more correctly achieve the tasks which they require.
In the “Findings and Recommendations” section, recommendations are included and attached to every key finding. Recommendations are also summarized in the “Conclusion” section of the report.
Introduction
The goal of the user test report is to answer two key questions regarding the “paper prototype”. First, can typical users of “self-directed investment brokerage accounts” figure out how to use the “Simplified Investment Interface With Professional Data” system? Second, what problems do users encounter when trying to look up stock data information on the proposed design?
The “Simplified Investment Interface With Professional Data” system is the proposed design of a stock trading interface with enhanced ability to source and present qualitative and quantitative stock research data. This idea is unique, seeing as though “self-directed investment brokerage accounts” targeting retail investors generally focus on trade execution functionality rather than stock analysis functionality. Though there are third party stock analysis web services providers, these are few and not well known to the general public. Therefore, our design proposes to bring some of this analysis feature set within the domain of self-directed investing, but also to streamline the interface to the point that it can be used with ease by members of the public that have varying levels of experience. The user test study aims to determine whether or not users can quickly figure how to use this “unique hybrid system” , and whether or not users encounter problems. If they do, the study aims to find what problems they encounter and to propose solutions. The study seeks to discover what difficulties or challenges users experience or what problems they encounter when they try to discover how to perform the tasks assigned.
The specific recruiting criteria which is used to filter out test participants, includes the following requirements; participants have used a “self-directed brokerage account” within the last two years, participants have researched company and/or stock information within the last two years, and participants have executed several stock trades. A pre-test interview is used to check that the user test participants meet these requirements.
The users are assigned four “low difficulty” tasks which aim to check whether or not the system is easy to comprehend, and whether it effectively delivers services requested. This report will cover an analysis of user tests performed of five participants. Lastly, for the issues discovered, we propose certain recommendations for re-design to enhance the system.
Methods
For this study, five user tests were assessed. The five user tests consisted of both a live user test sessions along with assessments of the user tests.
The first participant was Musician with low financial/technical expertise. The second participant was a Graphic Designer with proficient applied financial/technical expertise. The third participant was an Information Technologist with high technical/financial expertise. The fourth participant was a Digital Content Analyst with creative production expertise, but low technical/financial expertise. The fifth participant was a Spa Manager with low financial/technical expertise. All participants met the recruiting criteria of having used a self directed brokerage system within the past two years to place stock trades and research stocks. The participants with the lowest level of financial/technical expertise would be the most challenging to support, therefore their success was crucial to the success of the design. In addition, the relatively low level of experience of the participants chosen ensured that during their use of the system, their participation would promote a rigorous test of the system.
First, a script was used to explain the idea behind the tests and their purpose. Second, a pre-test questionnaire was used to warm up the participants to the tasks. Third, the users had to perform four tasks. We record the task timings, the completion rates, the severity levels, and record the evidence of any issues encountered as they attempt to perform tasks. Fourth, a post-test SUS questionnaire was used to determine the user’s perceived usability. And fifth, a debrief was used to gain insight into the high level information pertaining to user experience. For all tests, data was acquired in regards to the usability issues discovered by the users as they attempted to use the system. This qualitative data, and the associated design recommendations are outlined under the “Findings And Recommendations” section of this report. Lower priority findings are included in the “Appendix” section. Further, data was acquired in regards to completion rates, timings, ‘number of errors’ and severity ratings. This data is made available in the
“Summary Results” section.
The findings, recommendations and results are explained in the Conclusion.
5 Key Findings and Recommendations
FINDING #1 – All five participants were able to find the account performance relatively quickly and easily, mostly due to the button called “Performance” at the middle top of the page. Initially, participant #1 and participant #2 attempted to pull up charts by going to the “Holdings” page and looking for a performance history graph icon, image or button. Upon not finding this option, participant #1 & #2 correctly navigated to the “Performance” page. Additionally, participants #1 & #2 also attempted to pull up individual stock charts, by clicking on individual stock names. However, that functionality of individual stock price history was not designed within the prototype. Participant #1 and #2 pointed out that they also need to be able to see the price history at the stock level, so that they can make effective stock trading decisions. Severity: Low Recommendation: Include a pop-up “chart/price history” link for each individual stock, below each stock holding, on the “Holdings” page. (Participant #1 & #2, Task #1)
FINDING #2 – Participant #1 had a difficulty in finding the news for Apple stock, but eventually found it. Participant #5 did not find the news for Apple stock. Both participants scanned the “Home” page for a “News” section. They scanned the top of the interface for buttons which could provide some clues as to where to go. They even clicked “Holdings” and “Performance” buttons. These participants expected to find a “news” section, either on the “Home” page or the “Holdings” page. Participants #2, #3, and #4 went down the correct path. These participants initially searched for the “Apple” stock with the search bar. The “SHARE PRICE AND NEWS” graph popped up. Though participants #2, #3, and #4 correctly identified the round circles as icons for news events, participant #2 took a while longer to discover the significance of the round circle dots. Severity: Low Recommendation: Extend the width of the “top search bar”, to make it more prominent, and put “background text” on top of the line, that says “Search Public Companies Worldwide”. We believe that a more prominent search bar, in concert with an inviting label, will invite users to make the connection between finding a company and looking at the company’s news. (Participant #1 & #2 & #3 & #4 & #5, Task #2)
FINDING #3 – Participant #3 searched for “Apple” stock correctly, and due to experience with stock research, immediately found the tabs for the fundamental data. The participant stated that it did not make sense for the metrics of “Intrinsic Value”, “PE Ratio” “PEG Ratio” and “PB Ratio” to appear under the “Valuation” tab after a stock search. “What about the other metrics? Are they less important” stated participant #3. The participant recommended to make the “Summary” tab, the default tab that is open when someone does a search for a new public company. The summary tab includes an overview score of all of the major data tabs; Valuation, Health, Quality, and Future. Severity: Low Recommendation: Make the “Summary” tab the default tab that opens first after someone searches for a public stock, and place the tab on the left hand side of the other tabs. (Participant #3, Task #3)
FINDING #4 – Participant #3 and Participant #5 pointed out that the system did not provide for an “order status” page. There is no way to check for the status of an ‘open’, ‘filled’ or ‘cancelled’ order with the current prototype. There is no way to cancel an order which has not been processed, with the current prototype. Severity: Moderate Recommendation: Create an ‘order status’ page. (Participant #3 & #5, Task #4)
FINDING #5 – All of the participants were in universal agreement on the topic of documentation. The system needs to provide a statement of holdings, and yet this was not part of the prototype. Severity: High Recommendation: Create a ‘documentation’ page that can provide important downloads such as stock certificates and quarterly account statements. (All Participants, Discussion)
The user tests revealed that the product needs only a “low amount of work” to address the different technicalities which obstruct the flow of user action in the stock research and selection process or which do not provide for adequate functionality.
The “Simplified Investment Interface With Professional Data” paper prototype enables the users to quickly and easily research important quantitative and qualitative data on stocks, and to use that information to place trades within a seamless and efficient interface devoid of extra uncommon functionality. However, user testing revealed a number of flow and missing functionality issues, which may prevent some users from achieving their stock trading goals or simply from having a seamless user experience.
The success rate was 100% for Task 1, 80% for Task 2 & 3, and 60% for Task 3. On average, tasks were performed at normal speed. In addition, Tasks #1, #2 and #3 exposed “Low” severity issues, whereas Task #4 exposed a moderate severity issue. Examples of problems which users faced included; a missing “chart/price history” link for each stock, a small search bar without an explanatory background label, a “Summary” tab of information in the wrong position within the navigation flow, a missing ‘order status’ page and a missing documents provision facility for all important statements. Our design should be changed and expanded upon in functionality to address these issues.
Though users can perform stock trading and stock research in its current form, optimization is required to ensure a complete and seamless user experience.
SECTION 2: MED-FI PROTOTYPE
1. Sign In
2. Password Reset
3. Home
4. Holdings
5. Performance
6. Documents
7. Contact Us
8. Note Sent
9. Summary
10. Valuation
11. Health
12. Quality
13. Future
14. Order Status
15. Order Status (Historical)
16. Buy And Sell
Prototype Transitions
TASK FLOWS
Task #1 – Check the performance of a stock on the “Holdings” page.
Task #2 – Check the performance of the portfolio.
Task #3 – Check the “Summary” of the fundamental data for “Apple” stock.
Task #4 – Check the news of “Apple” stock.
Task #5 – Check all of the detailed fundamental data of “Apple” stock. This involves checking the valuation, health, quality and future expectations of earnings for the stock.
Task #6 – Check the “Order Status” history for previously filled transactions.
Task #7 – Send a stock buy or sell order.
Task #8 – Send an e-mail note to web support.
SECTION 3: APPENDIX
3.5) Raw Questionnaire Responses
Participant Codes
Participant #1 (P #1) – Musician with low financial/technical expertise. Participant #2 (P #2) – Graphic Designer with proficient applied financial/technical expertise. Participant #3 (P #3) – Information Technologist with high technical/financial expertise. Participant #4 (P #4) – Digital Content Analyst with creative expertise, but low technical expertise. Participant #5 (P #5) – The fifth participant was a Spa Manager with low financial/technical expertise.
Pre-Test Questionnaire
Have you used direct investing, for stock investing or stock trading, from any of the Canadian banks?
P #1 = yes, P #2 = yes, P #3 = yes, P #4 = yes, P #5 = yes
Tell me about the last time you placed a stock trade.
P #1 = I bought Giga Metals based on a recommendation from a friend. The stock dropped 60%. I don’t know now whether to double down on the stock, so as to get a better average buy in price, or whether to sell. I am stuck. I wish I had made my buying decision on something else other than friend recommendations.
P #2 = I bought PLI – ProMetic Life Sciences based on the rumour recommendation of a friend. The stock tanked to almost nothing. I lost 99% of my capital. I need to make up my own mind on purchases, rather than to listen to others.
P #3 = I set Alerts in my TD Direct Investing to alert me to when a stock had dropped sufficiently to make it a good buy. The Alert for Trevali came to my inbox when Trevali hit its all time historic lows. I bought the stock at a great entry price!
P #4 = I bought a Uranium ETF. I was tired from buying stocks, because no matter what stock I bought, I kept losing money on the trades.
P #5 = I bought stocks recommended to me by my son, using TD Direct Investing. The last stock I bought was Fortis, a safe utility stock.
What do you usually use to place a trade?
P #1 = TD Direct Investing, P #2 = TD Direct Investing, P #3 = TD Direct Investing, P #4 = TD Direct Investing, P #5 = TD Direct Investing
What is your primary purpose? Is it investing related or trading related?
P #1 = trading, P #2 = investing, P #3 = trading and investing, P #4 = trading and investing, P #5 = investing
What is your primary concern with “direct investing” systems you have used?
P #1 = no concern, P #2 = data may be wrong, not enough data, P #3 = user experience quality, not enough data, P #4 = no relevant information on resource companies, P #5 = it’s too complicated
What information is the most important when you are placing a trade?
P #1 = the business model of the company and their services, insight into operations, P #2 = the value and fundamental attributes of the company, P #3 = the health of the company, the value of the company, and the expected earnings of the future, P #4 = the news, what is happening on the ground with the company, what new opportunities there are, P #5 = is my money safe in this company, does it pay a dividend
How often do you use “direct investing” for “trading” or for “investing”?
P #1 = every week, P #2 = every month, P #3 = every day, P #4 = every month, P #5 = every 6 months
Debrief
Review parts of the test where the user struggled. What difficulties did you have on ____? I noticed you struggled with____, can you tell me what happened? You paused here, tell me more about that.
P #1 = I struggled a little to find the account performance. Initially, I looked at the holdings page, thinking there might be a performance chart for all of the stocks there. I tried to pull up individual stock charts, by clicking on the different stocks. Then, I spotted the “performance” button, and gave that a try. It worked, and I was able to pull up the total account performance there.
P #2 = I tried to find performance on the front page and on the holdings page. Failing that, I eventually navigated to the “performance” page.
P #3 = I searched for “Apple” stock. It immediately brought up the “Valuation” for “Apple” stock. This gave me pause for a sec. I didn’t ask for “Valuation”. I think it would make more sense to initially bring up a summary of “Apple” stock, when searching for the stock. It doesn’t make sense for the metrics of “Intrinsic Value”, “PE Ratio” “PEG Ratio” and “PB Ratio” to appear under the “Valuation” tab after a stock search. “What about the other metrics? Are they less important? The “Summary” tab available for “Apple” stock, is a great introduction to the stock.
P #4 = I know that I wasn’t asked to look for this, but I really struggle to use a system that does not provide me with proof of ownership of my financial assets. There does not seem to be a statement of holdings as part of this website system.
P #5 = The website doesn’t seem to provide a current status page. How can I check if my order went through? How can I cancel an order. There is no way to cancel an order which has not been processed. Preferences – What did you think of the site? What did you like/dis-like? Which parts of this page are most/least important to you?
P #1 = The prototype shows only a few key web pages. Most pages seem to be important. It seems to be missing functionality such as transferring money into and out of the account, and other things too, such as order status. But I guess I could switch to the advanced mode with the top button, to access those features.
P #2 = I like the fact that news is accessible from a performance history chart for the individual stocks. This way, I could always know what’s going on rather easily. I like the analyst expectations view of the future of the stock.
P #3 = I like how all of the important qualitative and quantitative data is presented in a really graphically pleasant and easy to digest way.
P #4 = I trade mostly resource companies, and I don’t see any of that kind of data here. This is all about fundamental valuation and balance sheet ratios, and that is only useful for mainstream investors.
P #5 = I really love the features. I love the ‘valuation’ tab specifically. This seems essential. I wish my direct investing interface had this data. It could help me to flag some companies as dangerous. The extra data presented by the website could help me to avoid making investment mistakes.
Changes – If you had a wishes to make this better for you, what would it be? Why?
P #1 = I would include stock reports section, with PDF reports from different sources. This would allow me to cross compare data, and find flaws regarding different companies.
P #2 = I would implement a stock ranking system. By knowing how stocks compare against one another, one can always find the leading stocks within any sector.
P #3 = I need an ‘order status’ website page. This way, I can monitor orders in real time.
P #4 = A website page about insight into the real company assets, not just financial tables. For example, the tab could show ‘the amount of copper a company owns’, not just the profitability. Real World Insight would provide a better understanding of the potential of profitability of the company.
P #5 = I don’t see any documents section. I like to have paper documents when it comes to my financial investments. I can’t download stock certificates. I can’t download a holdings summary of my stocks.
Understanding – How would you describe this to a friend?
P #1 = An investment trading program with convenient financial summaries., P #2 = A stock trading program with absolutely essential data., P #3 = A brokerage account with integrated professional data subscription service., P #4 = An advanced trading program for retail investors., P #5 = An easy to use direct investing program with good analysis tools.
Post-Test Questionnaire
Answer the following questions based on the scale of 1 – 5 where 1 is strongly disagree and 5 is strongly agree
1. I think that I would like to use this system frequently 1 2 3 4 5
P #1 = 5 4, P #2 = 5 4, P #3 = 5 4, P #4 = 3 2, P #5 = 5 4
2. I found the system unnecessarily complex 1 2 3 4 5
P #1 = 1 4, P #2 = 1 4, P #3 = 1 4, P #4 = 1 4, P #5 = 2 3
3. I thought the system was easy to use 1 2 3 4 5
P #1 = 4 3, P #2 = 5 4, P #3 = 5 4, P #4 = 5 4, P #5 = 4 3
4. I think that I would need the support of a technical person to be able to use this system 1 2 3 4 5
P #1 = 2 3, P #2 = 1 4, P #3 = 1 4, P #4 = 2 3, P #5 = 2 3
5. I found the various functions in this system were well integrated 1 2 3 4 5
P #1 = 5 4, P #2 = 5 4, P #3 = 5 4, P #4 = 5 4 , P #5 = 4 3
6. I thought there was too much inconsistency in this system 1 2 3 4 5
P #1 = 2 3, P #2 = 1 4, P #3 = 1 4, P #4 = 2 3, P #5 = 3 2
7. I would imagine that most people would learn to use this system very quickly 1 2 3 4 5
P #1 = 4 3, P #2 = 4 3, P #3 = 4 3, P #4 = 3 2, P #5 = 3 2
8. I found the system very cumbersome to use 1 2 3 4 5
P #1 = 1 4, P #2 = 1 4, P #3 = 1 4, P #4 = 1 4, P #5 = 1 4
9. I felt confident using the system 1 2 3 4 5
P #1 = 4 3, P #2 = 4 3, P #3 = 5 4, P #4 = 4 3, P #5 = 5 4
10. I needed to learn a lot of things before I could get going with this system. 1 2 3 4 5
P #1 = 2 3, P #2 = 2 3, P #3 = 1 4, P #4 = 2 3, P #5 = 3 2
Total:
P #1 = 34 x 2.5 = 85, P #2 = 37 x 2.5 = 92.5, P #3 = 39 x 2.5 = 97.5, P #4 = 32 x 2.5 = 80, P #5 = 30 x 2.5 = 75
“Phase 5” of “User Experience (UX) – Applied Research and Design (+Project)”
We have created a ”low fidelity” and a “medium fidelity” prototype. We have also conducted a user test. As part of “Phase Five”, we will now proceed to do one more full iteration through the design cycle. After completing this phase, we will have completed a “heuristic evaluation”, a “final prototype” and the “design of a user test”.
As part of the first step, a “heuristic evaluation” needs to be conducted and a “heuristic evaluation report” written. The aim of this evaluation is to find the design issues. The evaluation is conducted on the medium fidelity prototype. The evaluation involves coming up with a list of design violations, assessing severity, and then coming up with findings and proposing recommendations. Recommendations to fix the issues discovered need to be generated. Last, a heuristic evaluation report needs to be written.
The second step involves creating a “final interactive prototype”. You have to think about findings and recommendations outlined in the previous step, and then come up with solutions to the problems outlined. Ideation, brainstorming and sketching are all techniques one can use to come up with possible solutions. Then, once you have an idea of the best solutions, integrate them into the interactive prototype. Creating the last prototype isn’t just bout fixing issues identified by the heuristic evaluation, but it is also about ensuring that all of the basic screens and interactions that the user needs to perform, are addressed by the design. The interactions must be “complete”, meaning that pathways cannot lead to a “dead end”. The size of the design will depend on the scope, but generally, try to aim for a prototype with about: six to twelve main tasks, fifteen to thirty main screens, and include configuration tasks such as (login, sign-up, password change). Generally, you want to ensure all functionality is included that is necessary for a successful navigation of the design. You will also need to apply graphic design to enhance the fidelity of the prototype. The final prototype should be “interactive” or “clickable”, but it doesn’t have to be dynamic. You will have to create specific “data instances”, for each screen, so that you are able to run a final user test.
The third step involves designing a user test. The types of activities included in this step include; specifying the “target user population”, specifying the “recruitment process”, writing the “task instructions”, writing any relevant “questionnaires”, and also preparing the “consent forms”.
As part of this user test, there are two more considerations. First, new participants should be recruited. Re-using participants from the previous user test is not a good idea, because they have seen the system before and have become familiar with the logic of the system. Therefore, they will more easily navigate the system without issue, than a typical first time user. Second, in terms of tasks to test, more than half of the tasks tested should be new tasks.
The last point I want to touch on, is that user testing sessions can be conducted both “remote” and “in-person”.
Remote testing sessions have the advantage of providing useful data through an efficient, streamlined and quick process. Websites such as usertesting.com can provide central or even just supplementary research to a design project. If using remote testing sessions, it is important to choose a digital prototyping which allows for sharing of the interactive prototype online.
As for in-person testing, though they are time consuming to schedule, conduct and review, they do provide useful data that you would otherwise not have. For in-person testing, you need to set up video recording software or screen capture software in order to catch all of the details that you would otherwise forget, which occur throughout a test session.
The next section will demonstrate a heuristic evaluation report, a hi-fi prototype, task flows and a user test plan. The demonstration will be a presentation of “Phase 5” of our design project.
SECTION 1: HEURISTIC EVALUATION
Executive Summary
This report documents the “heuristic evaluation” of the “Simplified Investment Interface With Professional Data” mid-fi prototype. The purpose of this heuristic evaluation is to gain some experience in applying Nielsen’s heuristics to critique user interface designs. As I analyzed the mid-fi prototype, I referenced Nielsen’s heuristics continuously, looking for places where the interface failed to comply with the heuristics. Where I found a violation, I wrote down a description, the heuristic that was violated and took a screenshot. Lastly, I have compiled the data into this user experience report, where I outline a description, findings and recommendations.
Key Findings and Recommendations
Finding #1 – Description: After placing an order on the “Buy / Sell” stock order screen, the user is transitioned to the “Holdings” screen. The system does not present the updated status “of having received the order”.
System Location: “Buy / Sell” stock order screen.
Heuristic Violated: Visibility of system status
Severity: 3
Recommendation: Create a new screen with the “order detail record”. Place the screen after the user has sent an order through the “Buy / Sell” stock order screen .
Finding #2 – Description: After placing an order on the “Buy / Sell” stock order screen, the user is transitioned to the “Holdings” screen. The system does not present order preview feedback to the user after they have entered details in the “Buy / Sell” stock order screen. Errors which the user enters throughout the order process will result in faulty orders, with no ability to undo.
System Location: “Buy / Sell” stock order screen.
Heuristic Violated: User control and freedom
Severity: 3
Recommendation: Create a new screen to provide an “order preview” function. Place the screen after the user has send the order through the “Buy / Sell” stock order screen, but before the “order detail record” summary screen.
Finding #3 – Description: The user is able to navigate through the majority of the trading interface without needing to scroll up and down. This is a powerful minimalist design experience. Unfortunately, on the stock research tabs (Apple .. Summary Tab, Valuation Tab, Health Tab, Quality Tab, Future Tab) under the “Stock Info” screens, the user must scroll down for every individual tab to see the full information. This breaks the ease of navigation and adds an up and down vertical motion throughout the left to right navigation process.
System Location: Stock Info screens – Apple (Summary Tab, Valuation Tab, Health Tab, Quality Tab, Future Tab)
Heuristic Violated: Aesthetic and Minimalist Design
Severity: 3
Recommendation: To ensure minimalistic design and aesthetic flow, attempt to condense vertically, the ‘Stock Info” screens and all associated tabs. Make it such that vertical scrolling is unnecessary.
Finding #4 – Description: After clicking the “forgot password link”, and entering in the e-mail to mail a new password, the system does not provide the new feedback with the new status of having sent the email.
System Location: “Password resent link” screen.
Heuristic Violated: Visibility of system status
Severity: 2
Recommendation: Show a feedback note on the screen so as to notify the user of the status of the mail send operation.
Finding #5 – Description: After clicking on the “Contact Us” screen, and then proceeding to send a message, a screen pops up with a “Thank You! Note Sent!”. There is no exit from this screen to a gradual transition to a more useful area of the prototype.
System Location: “Contact Us – Thank You! Note Sent!” screen.
Heuristic Violated: User control and freedom
Severity: 2
Recommendation: Make a button that offers the user an exit from this screen, and a transition to a more useful part of the interface, the “Home” screen.
Finding #6 – Description: The four financial ratios (Intrinsic Value, PE Ratio, PEG Ratio and PB Ratio), are displayed on scales that are represented with a grey colour scheme. This does not provide new users any insight or information as to which part of the scale is healthy and which is unhealthy, which represents go or which represents stop. In the real world, red means go and green stop, red means unhealthy and green means healthy.
System Location: Stock Info screen – Apple, Valuation Tab
Heuristic Violated: Match Between System and Real World
Severity: 2
Recommendation: Use red and green colours to represent the ranges for the different financial valuation metric indicators.
Finding #7 – Description: The four financial ratios (Return on Equity, Return on Assets, Return on Capital Employed), are displayed on scales that are represented with a grey colour scheme. This does not provide new users any insight or information as to which part of the scale is healthy and which is unhealthy, which represents go or which represents stop. In the real world, red means go and green stop. Red means unhealthy and green means healthy.
System Location: Stock Info screen – Apple, Quality Tab
Heuristic Violated: Match Between System and Real World
Severity: 2
Recommendation: Use red and green colours to represent the ranges for the different financial quality metric indicators.
Finding #8 – Description: Font sizes are different for similar elements on different pages. Many font sizes are too small and the user will not be able to interpret.
System Location: “Home” screen, “Holdings” screen, “Performance” screen, “Login” screen
Heuristic Violated: Consistency and Standards
Severity: 2
Recommendation: Make similar text elements on different pages, the same size, so as to maintain consistent font sizing. Enlarge small font elements on the various pages.
Conclusion
The ‘heuristic evaluation’ of the “Simplified Investment Interface With Professional Data” mid-fi prototype revealed 8 useful findings. The heuristics most commonly violated were in the area of; “visibility of system status”, “user control and freedom”, “aesthetic and minimalistic design” and “match between system and real world”. The level of severity of the issues ranged between 2 and 3. The evaluation pointed out serious usability issues, severity 3, on the “Buy / Sell” order page and on the Stock Info pages. With the recommendations available, it is now possible to move on to the design of a high fidelity prototype.
SECTION 2: HI-FI PROTOTYPE
This section of the report contains 21 screenshots of the high-fidelity prototype. An interactive prototype version was uploaded online at the following address:
1. Sign In
2. Password Reset
3. Password Sent
4. Home
5. Holdings
6. Performance
7. Documents
8. Contact Us
9. Note Sent
10. Summary
11. Valuation
12. Health
13. Quality
14. Future
15. Order Status
16. Order Status (Historical)
17. Buy And Sell
18. Buy And Sell – Confirm Order
19. Buy And Sell – Order Detail
20. Pop-Up News
21. Prototype Transitions
TASK FLOWS
Task #1 – Check the performance of a stock on the “Holdings” page
Task #2 – Check the performance of the portfolio.
Task #3 – Check the “Summary” of the fundamental data for “Apple” stock.
Task #4 – Check the news of “Apple” stock.
Task #5 – Check all of the detailed fundamental data of “Apple” stock. This involves checking the valuation, health, quality and future expectations of earnings for the stock.
Task #6 – Check the “Order Status” history for previously filled transactions.
Task #7 – Send a stock buy or sell order.
Task #8 – Send an e-mail note to web support.
Task #9 – Retrieve password that was forgotten.
SECTION 3: USER TEST PLAN
User Testing Plan for “Simplified Investment Interface With Professional Data”
Test Goals
The goal of this user test is to answer the questions:
Can typical users of “self-directed investment brokerage accounts” figure out how to use the “Simplified Investment Interface With Professional Data”?
What problems do users encounter when trying to look up stock data information on the proposed design?
Recruiting Criteria
The principal audience for this test will be “users who have used and are familiar with online self directed brokerage accounts“. We define our recruiting criteria as:
Has used a “self-directed brokerage account” within the last two years.
Has researched company and/or stock information within the last two years.
Has executed several stock trades.
Test Preparation
Ensure that the interactive prototype is functionally complete and high fidelity.
Ensure that the interactive prototype supports all of tasks required of it for the test.
Run the interactive prototype through all of the tasks.
Pre-Test Checklist
Run the interactive prototype to ensure that it loads.
Check that the interactive prototype is feature and screen complete.
Pre-test Interview
The goal of the pre-test interview is to characterize the participants’ experience with self-directed, direct investing brokerage accounts.
Have you used direct investing, for stock investing or stock trading, from any of the Canadian banks?
Tell me about the last time you placed a stock trade.
What do you usually use to place a trade?
What is your primary purpose? Is it investing related or trading related?
What is your primary concern with “direct investing” systems you have used?
What information is the most important when you are placing a trade?
How often do you use “direct investing” for “trading” or for “investing”?
3.1) Task Instructions And Success Criteria
Task 1 – You want to buy some new commodity stocks, but don’t want to buy any of the companies which you’ve just recently purchased. Go to check which orders you have recently placed in the order history section of the application. Read the ticker symbols of the companies which have been purchased.
Success Criteria – Arriving on the “Order Status” page, followed by navigation to the “Historical” tab, will reveal the stocks which have been successfully filled.
Task 2 – You are frustrated with some stock value numbers which you have noticed in your stock holdings portfolio. You are not sure if something is wrong with your investments or whether there are simply technical glitches with the software you are using. You try phoning the company, but there is a long delay and you cannot get through. Send the company a short e-mail like message from within the investing interface, letting them know that there is “price inconsistency” with the stock holdings in your portfolio.
Success Criteria – The success criteria involves two steps. First, the user needs to arrive on the “Contact Us” page. Second, the user needs to write a message that there is “price inconsistency” with the stock holdings in the portfolio, in the message box. Third, the user needs to click “Send”, so as to send the message.
Task 3 – The stock market you have been following has recently crashed in price. All stocks seem to be a great value, the deal of a lifetime. You are excited to purchase some shares in a stock. Place an order for a stock and show the transaction receipt/order receipt. (Note: Do not concern yourself with choosing any particular company, as specific stock selection is not available for the purposes of this exercise.)
Success Criteria – The success criteria involves: finding on the “Buy / Sell” screen, sending an order for a generic stock trade, continuing through the preview order screen, and arriving at the “order detail/summary” screen.
Task 4 – You have been investing with a new technique. You wish to know if your new method of investing has allowed you to outperform the general market indexes for the Canadian or American markets. Find a chart that shows the performance of your entire account, and contrasts it with the performance of the main stock indexes.
Success Criteria – Arriving on the “Performance” screen, meets the success criteria.
Task 5 – The market has recently become very volatile. You are concerned with your sizeable position in “Apple” stock, but are not sure whether to hold as is or sell a part of your position. You decide to investigate. Find and read the latest news that is available for “Apple” stock.
Success Criteria – Success involves searching for Apple stock from the search bar, selecting the correct stock menu option, and finding the “price history chart”. Then, to achieve success, the participant must select the rightmost “circle dot”, on the performance history chart, to bring up the “latest news”.
Task 6 – You’ve listened to investment rumours in the past, and made some bad investment choices. Not wanting to repeat this mistake, you decide to take an analytical approach towards investing. Using your new investing interface tool, you decide to analyze all aspects of the company you are investigating, “Apple”. Find and read the detailed fundamental stock data for “Apple” stock, including; Valuation, Health, Quality, Future and Summary details.
Success Criteria – Success involves the user correctly finding and reading the values listed under the “Valuation”, “Health”, “Quality”, “Future”, and “Summary” tabs for “Apple”.
Task 7 – You use different passwords for different websites, and all of a sudden, you realize that you have forgotten your password to your direct investing brokerage account. Luckily, you realize that most online services have a feature for recovering your lost password access. Look for the password recovery option in the direct investing online interface and activate the recovery option to e-mail you the password.
Success Criteria – Success involves clicking “Forgot Password”, “Send Request” and “Return to Login”, beginning at the ”Login” page.
Post-Questionnaires:
For the post-test questionnaire, we will administer the standard SUS questionnaire on paper.
Debriefing Guidelines:
The focus of the debrief is to walk through any problems that were encountered during the tasks (question #1). If any time remains afterwards, ask higher-level questions 2-5.
Review parts of the test where the user struggled. What difficulties did you have on ____? I noticed you struggled with____, can you tell me what happened? You paused here, tell me more about that.
Preferences. What did you think of the site? What did you like/dislike? Which parts of this page are most/least important to you?
Changes. If you had 3 wishes to make this better for you, what would they be? Why?
Understanding. How would you describe this to a friend?
Use Cases. Under what circumstances would you use this? Why?
3.2) Consent Form
I agree to participate in the study of “Simplified Investment Interface With Professional Data project” being
conducted as part of . “…” . I consent to the recording of this test. This recording will be used for research and product improvements only. I understand that participation in this usability study is voluntary and I agree to immediately raise any concerns or areas of discomfort during the session with the study administrator. Please sign below to indicate that you have read and you understand the information on this form and that any questions you might have about the session have been answered.
Date:_______________
Please print your name: ____________________________________________________
Please sign your name: ____________________________________________________
Thank you! We appreciate your participation.
3.3) Logging Sheet
User Test Logging Sheet
Test Name, Logger, Participant ID, Date, Task Number, Task Success
Clock Time / Event Code / Notes
TASK START
Be sure to log start time for syncing later
3.4) User Test Script
Pre-Test Checklist
Double Check Success Criteria
Print Task Instructions (one per page)
Print Post-Test Questionnaire
Print Logging Sheet
Print This Test Script
Start Screen Recording
Post-Test Checklist
Stop Recording (save audio and video to backup drive)
File Informed Consent Form
File Logging Sheet
Introduction To “Simplified Investment Interface With Professional Data” project
Moderator: Thanks for coming in today! We’re constantly trying to improve our product, and getting your frank feedback is a really important part of that. The goal for today’s session is test an interactive prototype we have made for a new stock trading system we are designing. I’m here to learn from you so I’ll ask a lot of questions, but I’m not testing you. There are no right or wrong answers. I’ll start this session by asking some background questions. Then I’ll show you some things we’re working on, and ask you to do some tasks. As you work on the tasks, please think aloud. This means that you should try to give a running commentary on what you’re doing as you work through the tasks. Tell me what you’re trying to do and how you think you can do it. If you get confused or don’t understand something, please tell me. If you see things you like, tell me that too. I want to emphasize that, you won’t hurt my feelings by telling me what you think. In fact, frank, candid feedback is the most helpful.
User Test Script
If you do get stuck, I’m going to try not to answer your questions or tell you what to do. I’m just trying to see what you would do if you were using it on your own. But don’t Worry — I’ll help you if you get completely stuck. Do you have any questions before we begin?
Consent Form
Present Consent form, summarize it, and obtain signature.
Pre-Test Questionnaire
Have you used direct investing, for stock investing or stock trading, from any of the Canadian banks?
Tell me about the last time you placed a stock trade.
What do you usually use to place a trade?
What is your primary purpose? Is it investing related or trading related?
What is your primary concern with “direct investing” systems you have used?
What information is the most important when you are placing a trade?
How often do you use “direct investing” for “trading” or for “investing”?
Task Instructions
Print tasks and present them, one at a time. Read each task aloud and give the printed sheet to the participant.
Debrief
Review parts of the test where the user struggled. What difficulties did you have on ____? I noticed you struggled with____, can you tell me what happened? You paused here, tell me more about that.
Preferences – What did you think of the site? What did you like/dis-like? Which parts of this page are most/least important to you?
Changes – If you had 3 wishes to make this better for you, what would they be? Why?
Understanding – How would you describe this to a friend?
Use Cases – Under what circumstances would you use this? Why?
Conclusion
This has been incredibly helpful. Today, you mentioned… [Moderator: Try to briefly summarize some key parts of the discussion or issues.] Your input is really valuable for me and the team as we think about the next steps for these ideas. We really appreciate your taking the time to come in, and answering all of my questions. Thanks SO much!
[Moderator: Give participant incentive gift, if appropriate.]
3.5) Post-Test Questionnaire
Answer the following questions based on the scale of 1 – 5 where 1 is strongly disagree and 5 is strongly agree
I think that I would like to use this system frequently 1 2 3 4 5
I found the system unnecessarily complex 1 2 3 4 5
I thought the system was easy to use 1 2 3 4 5
I think that I would need the support of a technical person to be able to use this system 1 2 3 4 5
I found the various functions in this system were well integrated 1 2 3 4 5
I thought there was too much inconsistency in this system 1 2 3 4 5
I would imagine that most people would learn to use this system very quickly 1 2 3 4 5
I found the system very cumbersome to use 1 2 3 4 5
I felt confident using the system 1 2 3 4 5
I needed to learn a lot of things before I could get going with this system. 1 2 3 4 5
“Phase Six” of “User Experience (UX) – Applied Research and Design (+Project)”
The last phase of our “UX Research & Design Project” includes running a user test and producing a final project report.
First, as part of “running a user test”, the researcher needs to “conduct the test” and then to “review the test”. When “running the user test”, the goal is to discover the remaining issues with the prototype. Through the review, it becomes clear what still needs to be fixed with the prototype. Then the findings need to be documented. Specifically, the activities which need to be performed include: recruitment of participants, running the user test, logging the critical issues, identifying UX problems and compiling the results into a final report.
After “running the user test”, the researcher should quickly look at the findings and figure out which issues would be easy to fix and which issues would be difficult to fix. Before going on to the next step of writing the report, fix the design issues which are low complexity and easy to solve. For the more difficult design problems, problems which would take a long time to resolve, they need to be documented within the final report.
Second, as part of “producing a final project report”, the researcher needs to write a report that shows how the research performed supported the all of the design decisions made throughout the project. Though the researcher needs to extract key information from every step of the research process, the overall emphasis will be on the final prototype.
The following information should be included in the report.
Elements of the Final Report
The introduction section describes the design problem, target population, and system. The user experience research and design section will provide an overview of work completed, including; sketches and wire-frames drawn, user tests, user test analyses, and prototypes created. It neatly summarizes the work which has been completed throughout the five phases of the project. The user needs section describes how users address their needs and will identify needs. Supporting evidence should be provided.
The competitive analysis section will provide the conclusion to the competitive analysis performed earlier as part of the design process.
The design objective section states the goals of the design.
The prototype section shows the key tasks which the user can accomplish with the system. It should include images of the interface or screens, as well as, images of the task flows. The first user test section should consist of the goals, process, findings, recommendations and conclusion from the first user test. The section can discuss the design decisions and why they were made.
The last user test section should consist of the goals, process, findings, recommendations and conclusion of the last user test. The section can discuss the design decisions and why they were made. The resolved issues section should include the expertise gained from the exchange of information with the users and how the design created effectively supports user interaction. The unresolved issues section should include the problems which were not addressed and the potential solutions for the next variants of the design.
The additional information section should include any other relevant or key data discovered throughout the project.
Congratulations, you have arrived at the end of the course! Though we will not be able to provide a sample of the “phase 6 – final user experience report” within this course, we hope that you use the examples and detailed information provided within this course as a model or template for your future user experience research and design projects. Do not hesitate to come back to this course, and to use it as a refresher and a resource, whenever a new UX challenge presents itself. Again, thank you for registering and for completing this course.
FOR
students new to UX
students interested in UX Research
students interested in UX Design
job seekers who need to explain the UX process at an interview
“Discover the future of learning with Skills Gap Trainer, where technology meets art, and education transcends boundaries. Our innovative curriculum in AI, blockchain, user experience, digital marketing, and more, isn’t just about acquiring skills — it’s about mastering the art of possibility in a digitalized world. By linking to us, you’re not just sharing a resource; you’re igniting a beacon of knowledge that enlightens paths in technology, leadership, and beyond, for a global community of learners. Join us in our mission to bridge the skills gap and shape the future of education. Together, let’s empower minds across Canada, America, Europe, Britain, India, and beyond. Link to Skills Gap Trainer – where learning meets innovation, and every click opens a door to endless possibilities.“